Martin ERD
Draw Martin ER Diagrams (Martin ERD) easily with Edraw!
|
Edraw is a very easy-to-use and intuitive tool for easy database design and Martin ER Diagram design , which can save you hundreds hours of work. Edraw is not only an excellent tool for Database & ER Diagram, but also the one that allows you to design flowchart, program structures, create detailed HTML or PDF reports. |
Free Download Martin ERD Software and View All Examples
System Requirements
Works on Windows 7, 8, 10, XP, Vista and Citrix
Works on 32 and 64 bit Windows
Works on Mac OS X 10.2 or later
Martin ER Diagrams Software Features
- Built-in symbols: Allow even beginners to generate high quality Martin ER Diagrams quickly and effortlessly.
- Pre-drawn editable templates: Get started as quick as lightning especially for those time-crunched designers.
- Preset themes: Quickly add a designer-quality look and polish to your Martin ER Diagrams at 1 click.
- Broad file format compatibility: Create visual, ongoing, and collaborative Martin ER Diagrams.
- All-purpose diagramming function: Made 200+ kinds of visual diagrams (infographics) which can be included in your worksheet, e-mail message, presentation or document.
Learn How to Draw a Database Model Diagram.
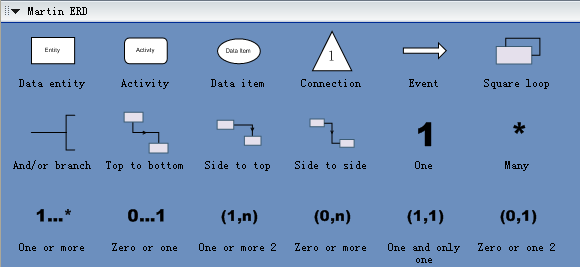
Symbols for Martin ERD
Edraw supports five types of diagrams: Chen ERD, Database Model Diagram, Express-G, Martin ERD and ORM Source Model.
Free Download Martin ERD Software and View All Examples
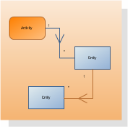
Rectangles and ovals represent entities, attributes or data items.
Simple lines indicate relationships, and adornments are added adjacent to the lines to indicate the type of relationship (written) and its connectivity (0, 1, *).
A line with a midpoint arrow indicates a message or data-flow.
Simple lines connected by a dot indicate a Boolean and/or computation.
A rounded rectangle represents activity.
A large arrow stands for an event.
A triangle with a numeric label means a connection.
When modeling a real-world phenomenon, it can often be useful to have multiple descriptions of the phenomenon, each expressed by using a different modeling approach or representation. Different representations such as entity-relationship modeling, data flow modeling and use case modeling allow analysts to describe different aspects of real-world phenomena. Thus, they provide a more thorough understanding than the understanding provided when a single representation is used. Researchers working with multiple representations have approached the problem from different directions, resulting in a diverse and potentially confusing set of terminologies.
Relative Resources


