Gantt Chart Software for Linux - Schedule Your Projects Efficiently
A gantt chart is a specialized bar chart commonly used in project management to provide a graphical overview and schedule of all tasks or to indicate the work elements and dependencies of project. On the left of the chart is a list of the activities and along the top is a suitable time scale. Each activity is represented by a bar; the position and length of the bar reflects the start date, duration and end date of the activity.
Introduction of Powerful Linux Gantt Chart Software
Edraw gantt chart software for Linux is not only a great option for large, global companies for its powerful and professional functions but also a good choice for small business for its affordable price. It is compatible with Microsoft and has a similar layout with it which make Edraw very easy to use.

System Requirements
Compatible with the most popular Linux distributions such as Debian, Ubuntu, Fedora, CentOS, OpenSUSE, Mint, Knoppix, RedHat, Gentoo and More.
Features of Gantt Chart Software for Linux
Free Download Gantt Chart Software to Create Awesome Gantt Charts on Linux Easily:
Edraw Project: a professional interactive Gantt chart tool
- Visualize how projects evolve over time
- Schedule, mange, and track your projects in real-time
- Provide various Gantt chart templates and easy-to-use
- Easy to estimate project costs and manage budgets
- Compatible with MS office files (e.g. Microsoft Project)
- Collaborate with team members effortlessly
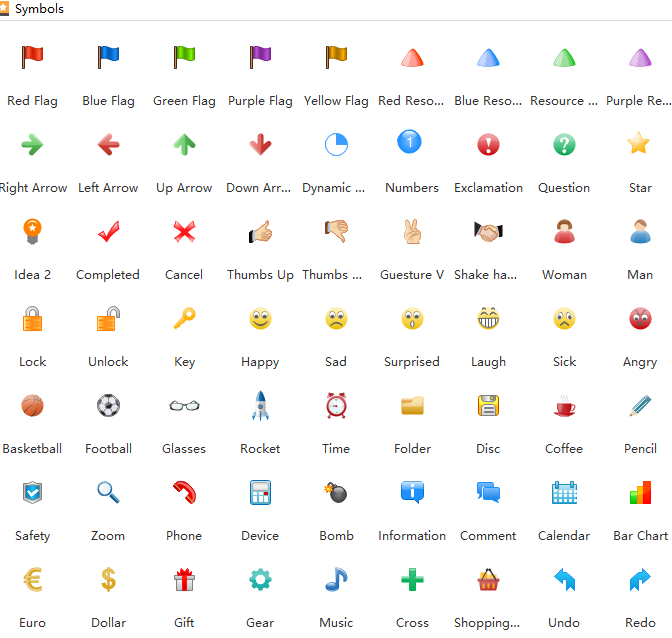
Built-in Gantt Chart Shapes
Below are gantt chart shapes provided by gantt chart software for Linux. Just drag it and drop on the drawing page to create your own gantt chart.
Steps to Create Gantt Chart on Linux
Follow below simple steps and you will find creating gantt chart on Linux is such an effortless and interesting thing.
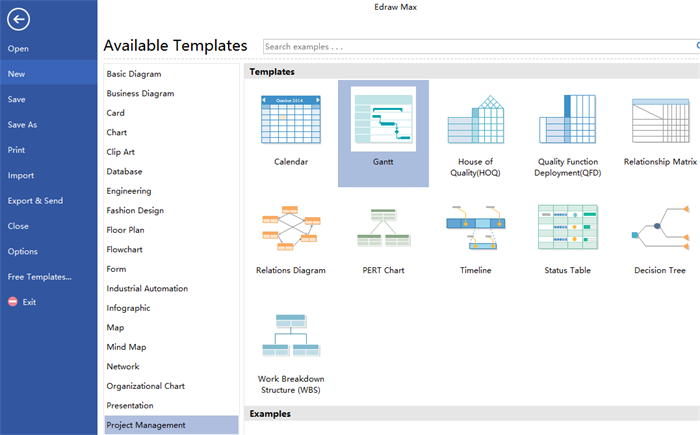
Step 1. Launch the software, go to File menu > New > Project Management and then double click the icon of Gantt under templates window to open a blank drawing page.
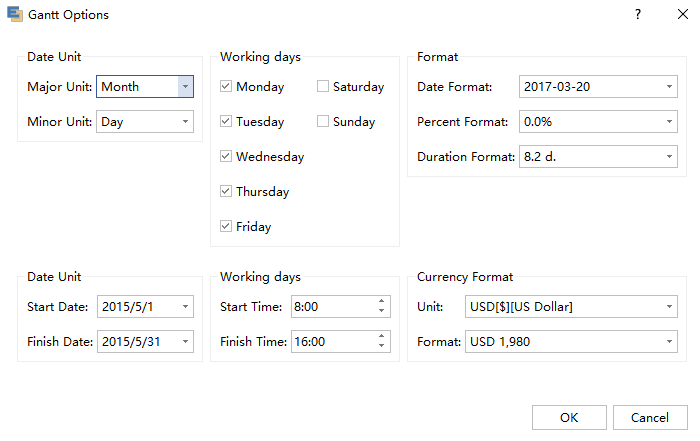
Step 2. Drag and drop a gantt chart shape on the drawing page, then set the necessary information on the dialog window, such as date unit, working day, format, etc.
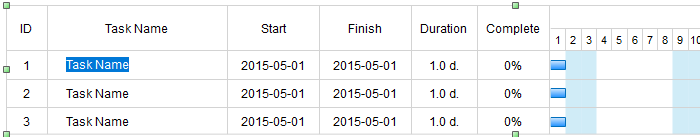
Step 3. Double click the text and edit the task names.
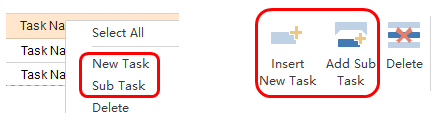
Step 4. Add a new task or sub-task by right-clicking or clicking the first two buttons directly under Gantt Chart menu.
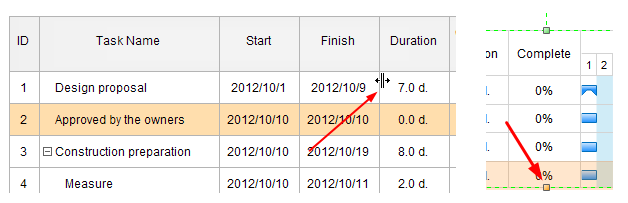
Step 5. Set the column width by putting the mouse cursor on the line between two cells and drag to the width you want; set the row width by dragging the yellow point in below picture.
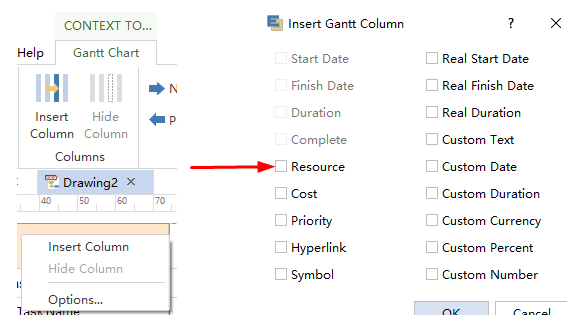
Step 6. Right click your mouse or click Insert Column under Gantt Chart menu to add a new column if necessary.
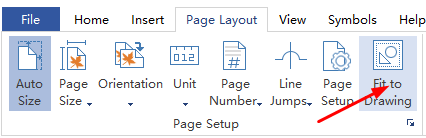
Step 7. Go to Page Layout and click Fit to Drawing to lay out the gantt chart.
Reasons to Use A Gantt Chart for Project Management
More and more companies choose gantt chart as their project management tool to enhance their communications, forecast over the long term and track results because of the mang advantages offered by it. Here lists 5 fundamental reasons why companies use gantt charts for project management.
- Gantt charts are created to keep users on track, providing a visual timeline for starting and finishing specific tasks, which can avoid completion confusion to a great extent.
- Gantt charts can be used to replace meetings and enhance other status updates, which provides an easy and visual method to help team members understand task progress.
- A gantt chart is a great tool to reduce burden which makes reporting clearly and straight-forward. Employees can report on the progress with the scheduled activities.
- These charts can make clear how various tasks are interrelated and perhaps rely on the completion of another to meet specific objectives.
- The scheduling function of gantt charts helps teams members understand the overall impact of project delays can foster stronger collaboration while encouraging better task organization.
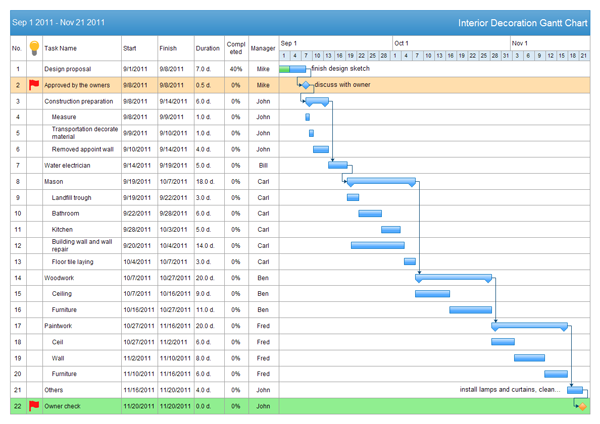
Gantt Chart Examples
Below is a gantt chart examples created by our Linux gantt chart software. All the examples it created can be freely download and easily edit and share. Just download the one you like and customize it to your own with no hesitate.
Related Articles:
Learning to Gantt Chart - 10 Best Practices
Gantt Chart vs. Pert Chart - What Are the Differences?
WBS Software for Linux - Create Hyper-Efficient WBS in Minutes


