Linux Bubble Chart Software - Create Bubble Charts in More Efficient Way
Bubble Chart Software for Linux - Overview
This Bubble Chart Software for Linux is definitely a lightweight yet powerful bubble chart diagramming tool, which helps you create bubble charts in minutes. It covers a large collection of shapes and templates, as well as dynamic help guide, you are able to design and customize the drawing quickly.

Download This Program to Draw Bubble Charts on Mac, Windows and Linux:
System Requirements
Compatible with Linux system including Debian, Ubuntu, Fedora, CentOS, OpenSUSE, Mint, Knoppix, RedHat, Gentoo and More.
Advantages of This Linux Bubble Chart Software
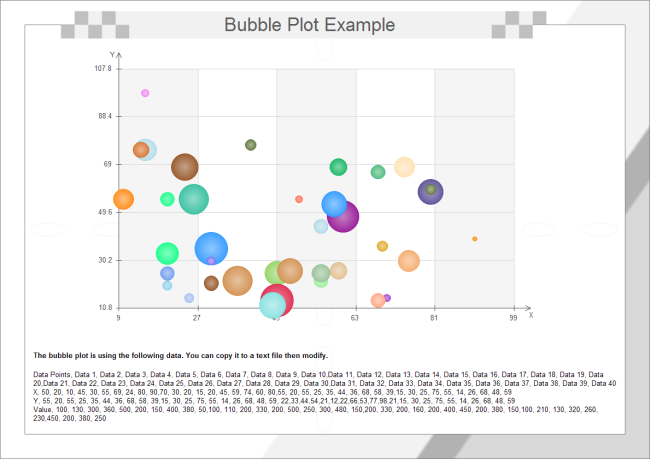
- Set chart data conveniently by loading data from file.
- Change the format of bubble charts flexibly, you can adjust sizes, colors and fill effects of individual bubbles or an entire bubble series.
- Replace bubbles with pictures whose sizes are automatically adjusted according to the bubble size for each corresponding value.
- Gain help by dragging and dropping the dynamic user guide or click the manual link.
- Various export options including BMP, JPEG, PDF, SVG, HTML, Word, PowerPoint and much more format.
Bubble Chart Symbols
Run this software, you will get free vector bubble chart symbols like likeincluding circle, ellipse, cloud, main idea, grey bubble, blue bubble, pink bubble, iridescence bubble, highlight circle, highlight ellipse, highlight cloud, highlight main idea, connector, etc. TUsers are able to edit, customize these symbols.
Simple Steps to Create Bubble Charts on Linux
Following are easy steps to draw a bubble chart on Linux:
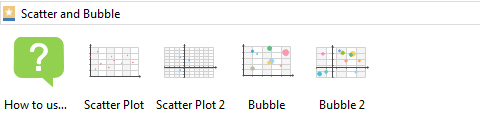
- Go to "File" menu > "New" > "Chart", and then double click "Bubble Chart" icon to open a blank drawing page, or you can also select an existing example to get started.
- Drag and drop shapes from the left library to the drawing page. On the upper right of the bubble chart shape, you may find a floating button, you can set point number by clicking it.
- Double click the shape and then type in text.
- Once the bubble chart completed, click "Save" on "File" tab to save the file as the default eddx format, or choose "Save as" on "File tab" to save as other formats such as jpg, png, pdf, etc.
Learn an ultimate guide on how to create bubble charts.
Bubble Chart Examples
Simple free download those bubble chart examples created by our bubble chart design tool on Linux, edit and share them.
Bubble Chart Example One
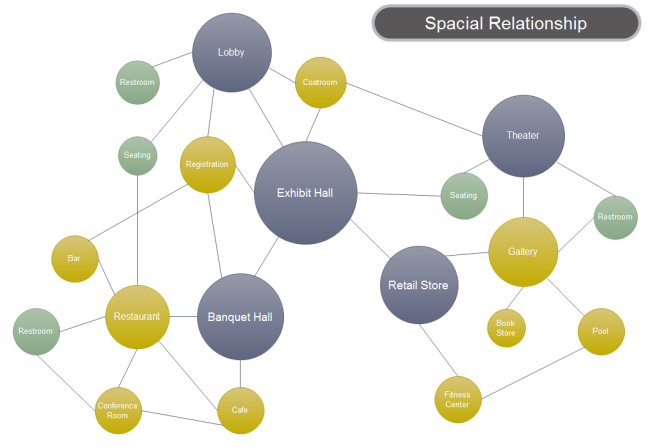
Bubble Chart Example Two

Bubble Chart Example Three
Further Reading
Linux Bar Chart Software - Draw Your Own Bar Charts As You Desire
Best Linux Invoice Software - Perfect for Business And Freelancers
Linux Certificate Software - Make Professional Certificates Quickly
Spider Chart Software for Linux
Concept Map Software for Linux - Make Professional Concept Maps Effectively


