How to Create a PERT Chart
Part 1: What is PERT Chart?
Program Evaluation and Review Technique - PERT charts are typically drawn before a project begins to determine the minimum time necessary to complete a task or project and make risk assessments. Project managers often use them to map out the scope of their projects and to avoid any roadblocks during the process.
PERT charts offer managers and team members an overview of the project, as well as an approximate time-frame for each task. It keeps everyone in the team informed about what tasks need to be done, how much budget needs to be allocated, and if there are any dependencies between steps.
Part 2: How to Create a PERT Chart Effortlessly?
Step 1: Start EdrawMax.

An all-in-one platform for 210+ diagrams.
・ Simple alternative to Visio
・ 26k+ symbols
・ 10K+ free templates
・ 10+ AI diagram generators


Step 2: Navigate to [New]>[Project Management]>[PERT Chart]
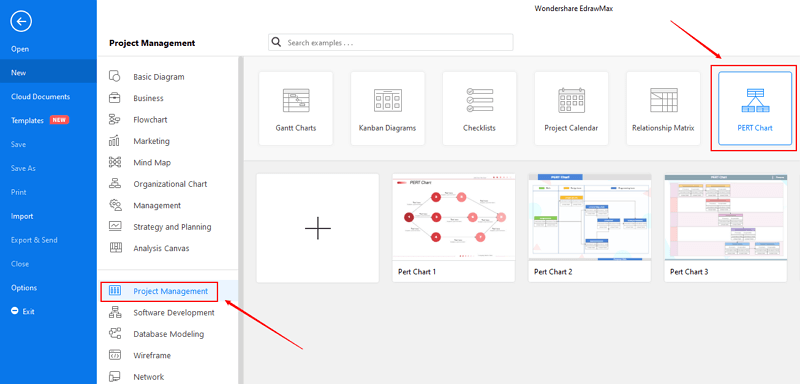
Step 3: Select one PERT chart template to edit on it or click the [+] sign to start from scratch.
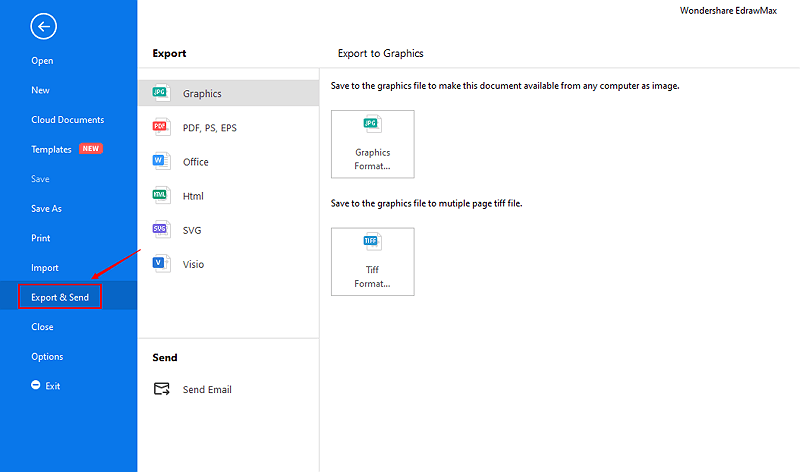
Step 4: You can export the file to Graphics, PDF, editable MS Office file, SVG and Visio vsdx file.
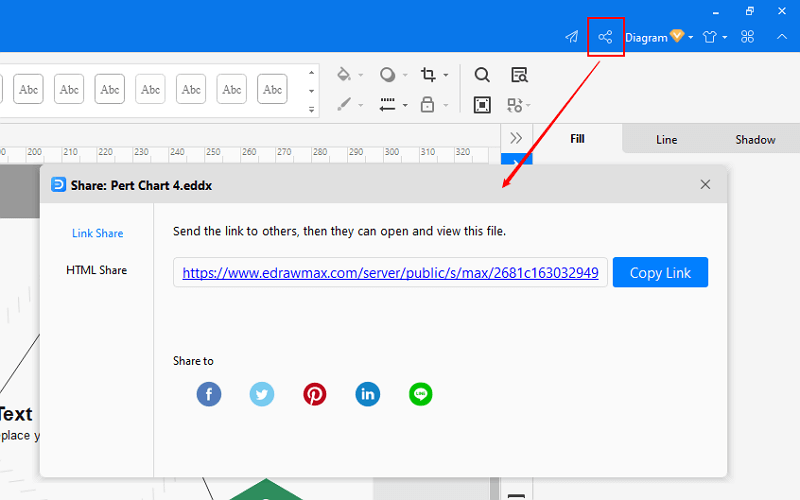
Step 5: And you can share your diagram with others via social media and online website page.
Part 3: An Introduction to the Basic Setting for Task Box
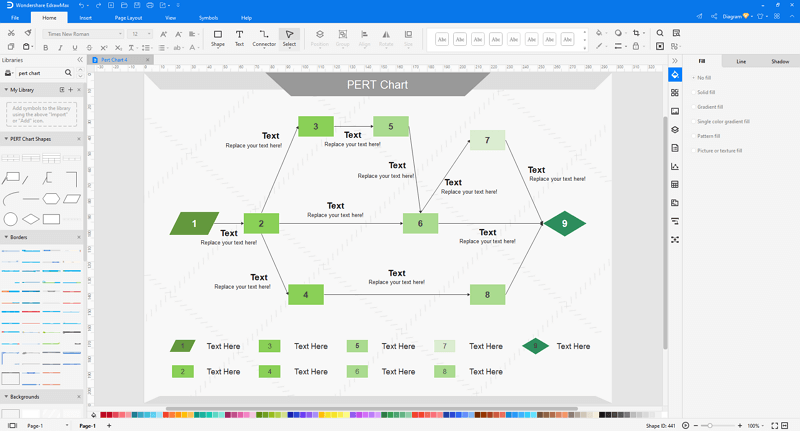
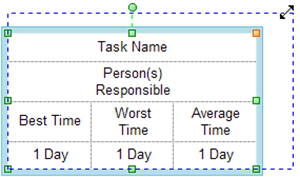
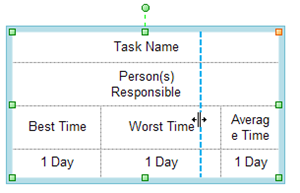
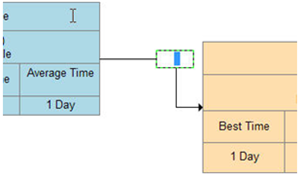
- If you want to change the task box size, you can drag the green resizing handles to change the table size. Just place the mouse cursor on the line between two cells and drag it, just like the way excel does.
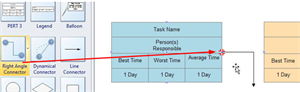
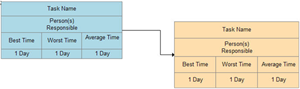
- If you want to connect task boxes with dynamic connectors, you can drag a connector from the library and approach the blue X mark appearing on the box. When it turns red, release your mouse, the connector will be snapped and glued with the box. Connect the other end of the connector with another box in the same way.
- If you want to add descriptions for connectors, you can double click the connector, and then a text box will show up. Just type the text and click blank area to finish editing. Continue connecting boxes with connectors until you finish the chart.
Part 4: PERT Chart Examples
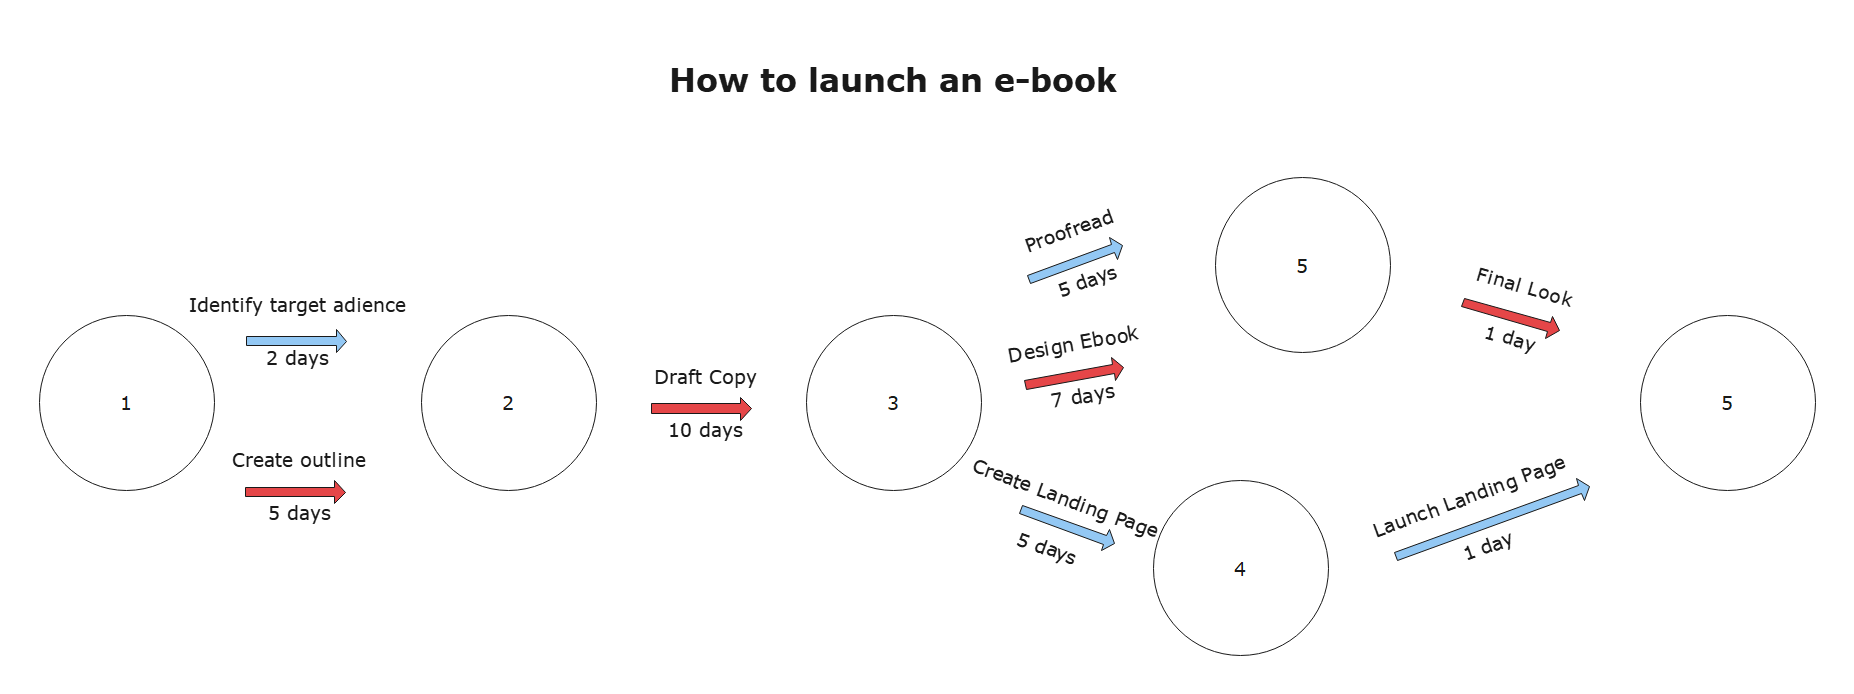
Example 1: How to Launch an E-book
A pert chart is used to identify the key, necessary steps to achieving a certain goal. In this example, this is used to document the steps required to launch an e-book. One useful feature of a PERT chart is you are able to plot the most critical path, seen by the red arrows. This will inform you of the path that takes the least amount of time to accomplish your overall task.
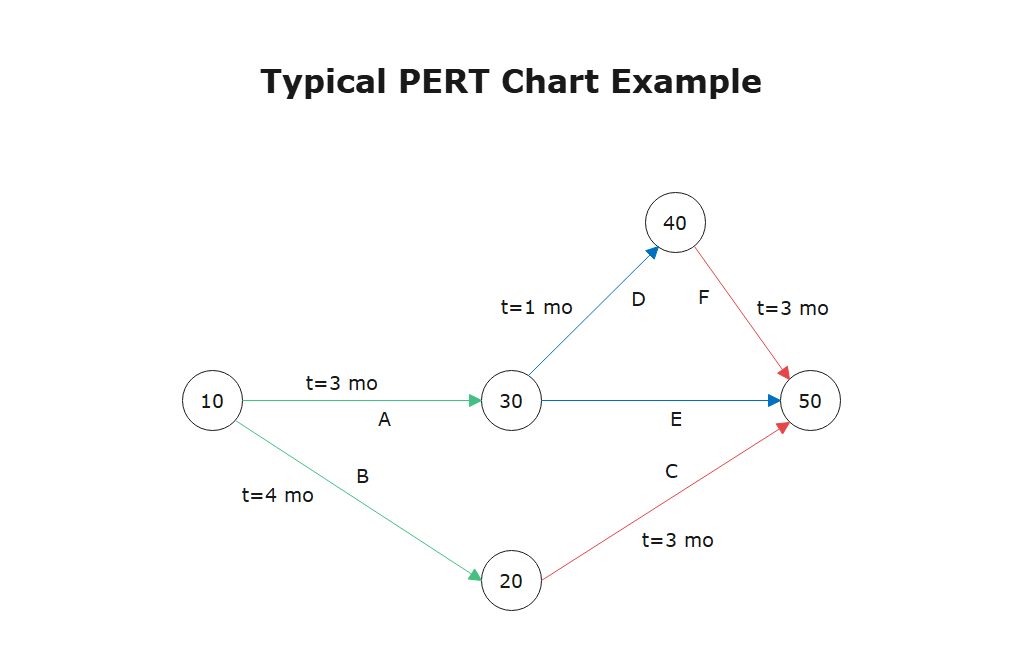
Example 2: Typical Pert Chart Example
PERT charts offer managers and team members an overview of the project, as well as an approximate time-frame for each task. By noting down how long each step will take, you are able to identify what the most critical path is, and how much time and resources need to be devoted to a certain path in order for the task to be completed on time.
Part 5: Conclusion
According to this article, there are mainly four parts to illustrate what is PERT chart, to tell you how to create a PERT chart easily with EdrawMax, to introduce the basic setting of task box to you, and to show you some PERT chart examples.
EdrawMax is an easiest all-in-one diagramming tool, you can create PERT charts and any other type diagrams with ease! With ready-made PERT chart symbols and cliparts, making PERT charts could be as simple as possible. Also, it supports to export your work in multiple formats and share your work with others. Get started to create your PERT charts now!
More Related:


