Download Free Spider Chart Templates
A spider chart, also named "radar chart", "web chart" and "polar chart", is a chart that consists of several equal-angular axis radiating from the same coordinate origin. Each axis represents a variable and the point on the axis indicates the magnitude a variable. For each object, a curved line is drawn to connect all the data values on each axis. When there are multiple objects compared in a spider chart , the chart looks like a cobweb.
Free Spider Chart Templates
The following are some spider charts designed by Edraw chart maker. You can click on the picture to download them for free and get inspirations from them. If you like the template, it is easy to customize them for flexible use.
Spider Chart Templates - One Object
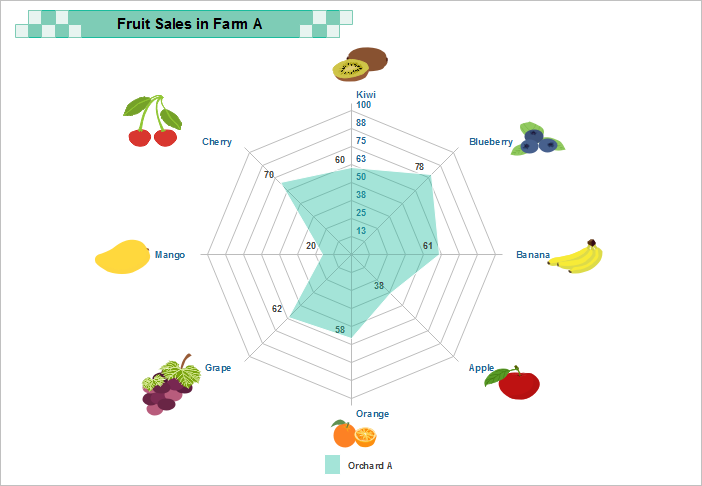
The following is a spider chart of products sales in an orchard. Each of the 8 products of the orchard example form individual axes which have been arranged radially around the coordinate origin. The sales value of each product is illustrated by a dot on the corresponding axis. A line is drawn connecting the data values for each axis, showing all your data values at one go!
Spider Chart Templates - Multiple Objects
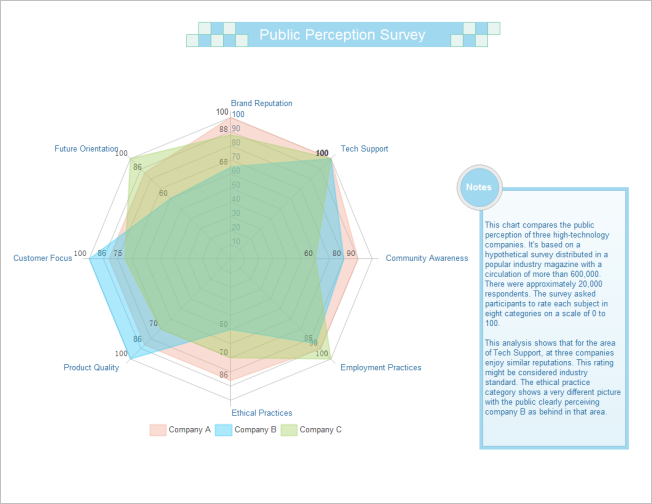
The template above shows the sales information of the 8 fruits in a farm. What if you need to display and campare the same information of multiple objects? Now imagine you need to investigate the public reception of 3 companies.
The 3 companiesare ranked on each of the 8 parameters. The color coding for each company helps to visually correlate and contrast the companies over its diverse aspects. If you need the company to have good product quality, the chart gives you an indication that maybe you should choose Company B (as Company B has a higher rank in Product Quality to A).
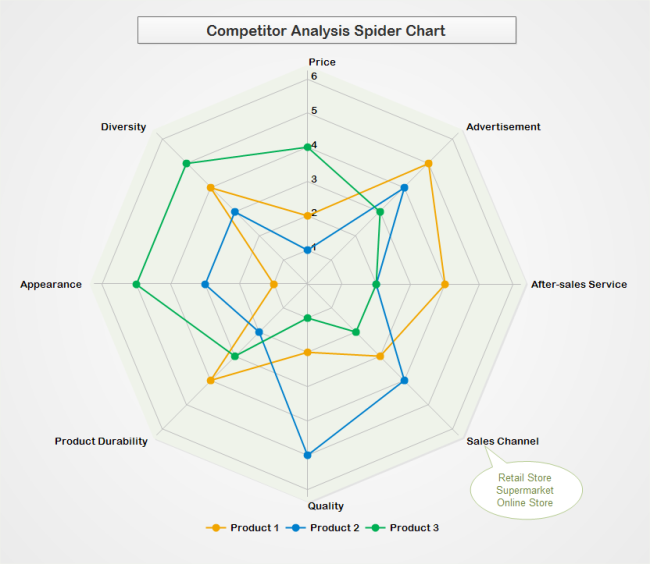
Competitor Analysis Radar Chart
This is a spider chart analyzing three products that compete against each other. A comparison of appearance, product durability, quality, sales channel, after-sales service, advertisement, price and diversity is made among them.
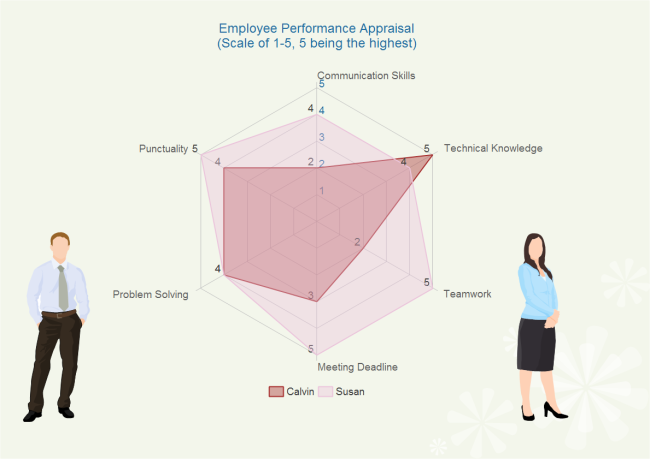
Performance Appraisal Spider Chart
Below is a performance appraisal spider chart of Calvin and Susan. It can be applied to find out the most qualified employee. From the clear display of data, employees' strengths and deficiencies can be found out instantly.
Score Analysis Spider Chart
The score analysis spider chart displays the test scores of Lucy and Tom in geography, physics, chemistry, biology, computer science and math. From the spider chart, you can tell their score levels at one glance. Lucy is above the average level in all subjects and Tom is below the average level except computer science.

Create Spider Charts with Edraw Chart Maker
- Go to the File> New> Chart menu, and then double-click Spider and Radar to open a blank drawing page or choose a built-in template.
- Drag and drop vector symbols from Spider libraries on the left of your screen to the drawing page to draw the enrich your chart.
- After completing the spider chart, click File -> Export & Send, select PDF, PS, EPS> PDF Vector Format or PDF Image Format to export it.
- Browse your computer and choose a location to save your PDF file.
Download the easy chart maker to customize professional spider charts.
Related Articles:


