Cross-Functional Flowchart
- What is a Cross-Functional Flowchart
- Purpose and Benefit
- What are Cross-Functional Diagrams Used For
- What is the difference between Deployment Flowcharts & Cross-Functional Flowcharts
- How to Analyze Cross-Functional Flowcharts
- What to Do Before Creating Cross-Functional Flowcharts
- Cross-Functional Flowcharts Software
- How to Make Cross-Functional Flowcharts in EdrawMax
- Tips for Making Cross-Functional Flowcharts
- Cross-Functional Flowchart Example
- Conclusion
What is a Cross-Functional Flowchart
When it comes to visually illustrating the roles of people of a department or multiple departments in an organization to perform mission-critical processes, regular flowcharts fail to serve the purpose to the full. This is where a cross-functional flowchart comes into play that not only shows the tasks that need to be completed. It also portrays the department or personnel who have been assigned to get the job done.
Purpose and Benefit
The main purpose of a cross-functional flowchart is to illustrate the number of departments or people involved in accomplishing a particular goal, be it manufacturing a product, developing a program, or even training.
One of the major benefits of such a chart is, it gives a complete insight into the process or multiple processes at a single glance, without having the analysts or the administration staff to go through the lengthy sentences that they would otherwise have to do in the absence of illustrations.
What are Cross-Functional Diagrams Used For
In a nutshell, a cross-functional flowchart makes it easier for the management to analyze the entire workflow and the people involved in it. This further helps them assess the current and future requirements of the manpower, thus giving them enough time to prepare for recruitments for enhanced production.
For instance, if an organization is planning to get into manufacturing laptop computers, having a well-drawn cross-functional flowchart enables the administrators to see how many departments would be needed to prepare a quality machine and how many people each department should have to keep the process run flawlessly.
What is the difference between Deployment Flowcharts & Cross-Functional Flowcharts
As far as I have seen, there is no significant difference between both. Actually, deployment flowcharts and cross-functional flow-charts seem to be two synonyms for the same concept, otherwise referenced in one paper as a "Process Map". Diagrammatically, Deployment charts seem to me more like UML Activity diagrams with Swim lanes (if you're familiar with UML you'll immediately understand what I mean). In other words, deployment diagrams are flowcharts that focus on showing "who does which activity". I've come across a definition that says "A Deployment Flowchart shows the actual process flow and identifies the people or groups involved at each step.
This type of chart shows where the people or groups fit into the process sequence, and how they relate to one another throughout the process." I also came across a paper that identifies both as being the same: "The process map-otherwise known as a cross-functional flowchart or deployment chart-is an excellent tool for clearly displaying process flows across organizational boundaries and identifying delays, repetitive steps, excessive control points, specialized tasks, and potential points of process failure." So, I believe it is plausible to assert that cross-functional charts and deployment charts both refer to the same concept.
How to Analyze Cross-Functional Flowchart
A process can be an enlightening yet shocking experience. Processes typically evolve over time as people and business conditions change. The result is unneeded layers of complexity and inspection. Your first reaction may be, "Is that really what we do?"
Your
second reaction will be to fix the process. Here's a list of what you should
look for: Non-value added steps. Challenge each process step. Ask yourself,
"What value does this activity add? Does our customer care?" Combine, simplify
or eliminate activities that do not contribute value.
Excessive control points. Inspections and supervisor approvals do not always add
value. They evolve primarily due to a lack of confidence in the process.
Eliminate control steps that are not critical for quality outcomes.
Excessive handoffs. Every time process activities move from one player to the next, there is potential for delay or miscommunication. Try to organize work so that each player becomes more of a generalist and less of a specialist. This will reduce the complexity of multiple handoffs.
Task specialization. Assembly line processing is giving way to cellular models for organizing work groups or teams, both on the plant floor and administrative offices. Information flows faster, with less distortion, improving both the quality and speed of work. Consolidate tasks where possible.
What to Do before Creating Cross-Functional Flowcharts
As mentioned earlier, a cross-functional flowchart helps the management assess which department should perform what role to complete a process. At an even granular level, the chart also talks about the responsibility of each individual involved in the job. Therefore, before starting with preparing a cross-functional diagram, you must:
- Know Final Output
Taking the example discussed before, if you are planning to start a laptop manufacturing plant, it is imperative to know what kind of PC you want to offer to the end-users at the end of the day.
- Understand the Steps Involved
The next thing that you should have on your desk is a rough blueprint indicating the steps that must be involved in getting the job done.
- Distributed Responsibilities
With the correct assessment of the steps, look for ways to simplify the processes by distributing the tasks among multiple departments. This helps the staff members focus on only one objective to ensure quality production, rather than being overloaded with several responsibilities.
- Budget
This is probably the most important part of the entire process as it helps you assess how many people you can involve, how many more staff members you can hire, or even how many of them should be assigned to a different department for smooth production.
- An Efficient Drawing Tool
Gone are the days when people used to draw diagrams and charts on chart papers using markers and sketch pens. With the evolution of the digital era, where most of the things are being done on computers and smart devices, it becomes extremely important to pick an efficient diagramming tool such as Wondershare EdrawMax to expedite the preparation of an error-free cross-functional flowchart that can be viewed on the screens and can even be shared online or printed for reference.
With the above points in mind, you can jump right into creating a cross-functional flowchart.
Cross-Functional Flowchart Software
The essential purpose of this template is to help you diagram the relationship between a business process and the responsible party. Edraw supports both horizontal and vertical cross-functional flowcharts.
Free Download Flowchart Software and View All Examples

An all-in-one platform for 210+ diagrams.
・ Simple alternative to Visio
・ 26k+ symbols
・ 10K+ free templates
・ 10+ AI diagram generators


How to Make Cross-Functional Flowcharts in EdrawMax
When EdrawMax is talked about, it is backed by a globally recognized and trusted brand like Wondershare. Further, EdrawMax is not only capable of drawing a cross-functional flowchart but can also be used in various other industries such as construction, software development, mechanical engineering, computer networks, marketing, organizational hierarchy, etc.
After downloading and installing Wondershare EdrawMax on your computer, you can follow the step-by-step instructions given below to draw a simple or even complex cross-functional diagram:
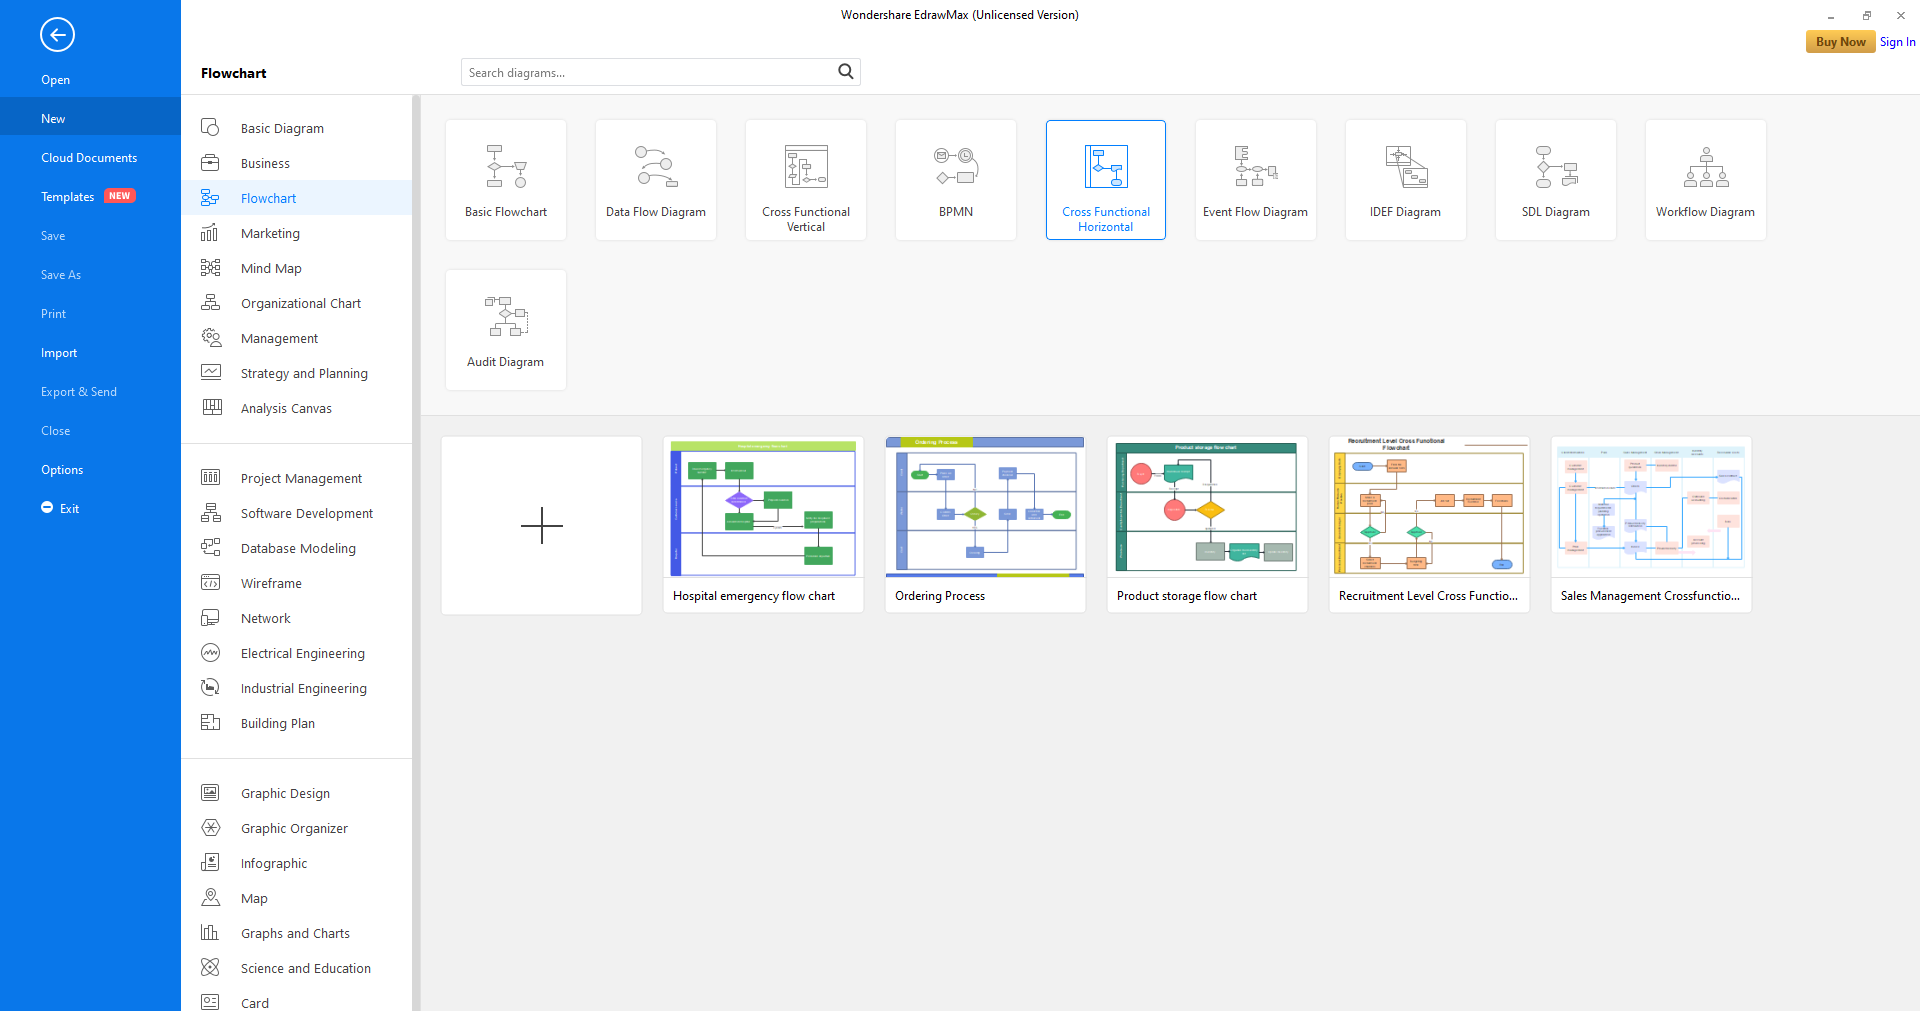
Step 1: Pick a Template to Start With
Launch EdrawMax on your computer (a Windows 10 PC is used here for illustration), click Flowchart from the categories pane in the left, and click Cross-Functional Vertical or Cross-Functional Horizontal template category from the top row in the right window. From the lower section of the window, click to select your preferred template as per your needs. Note: You can choose any template that you like and then rename its fields to match your industry type.
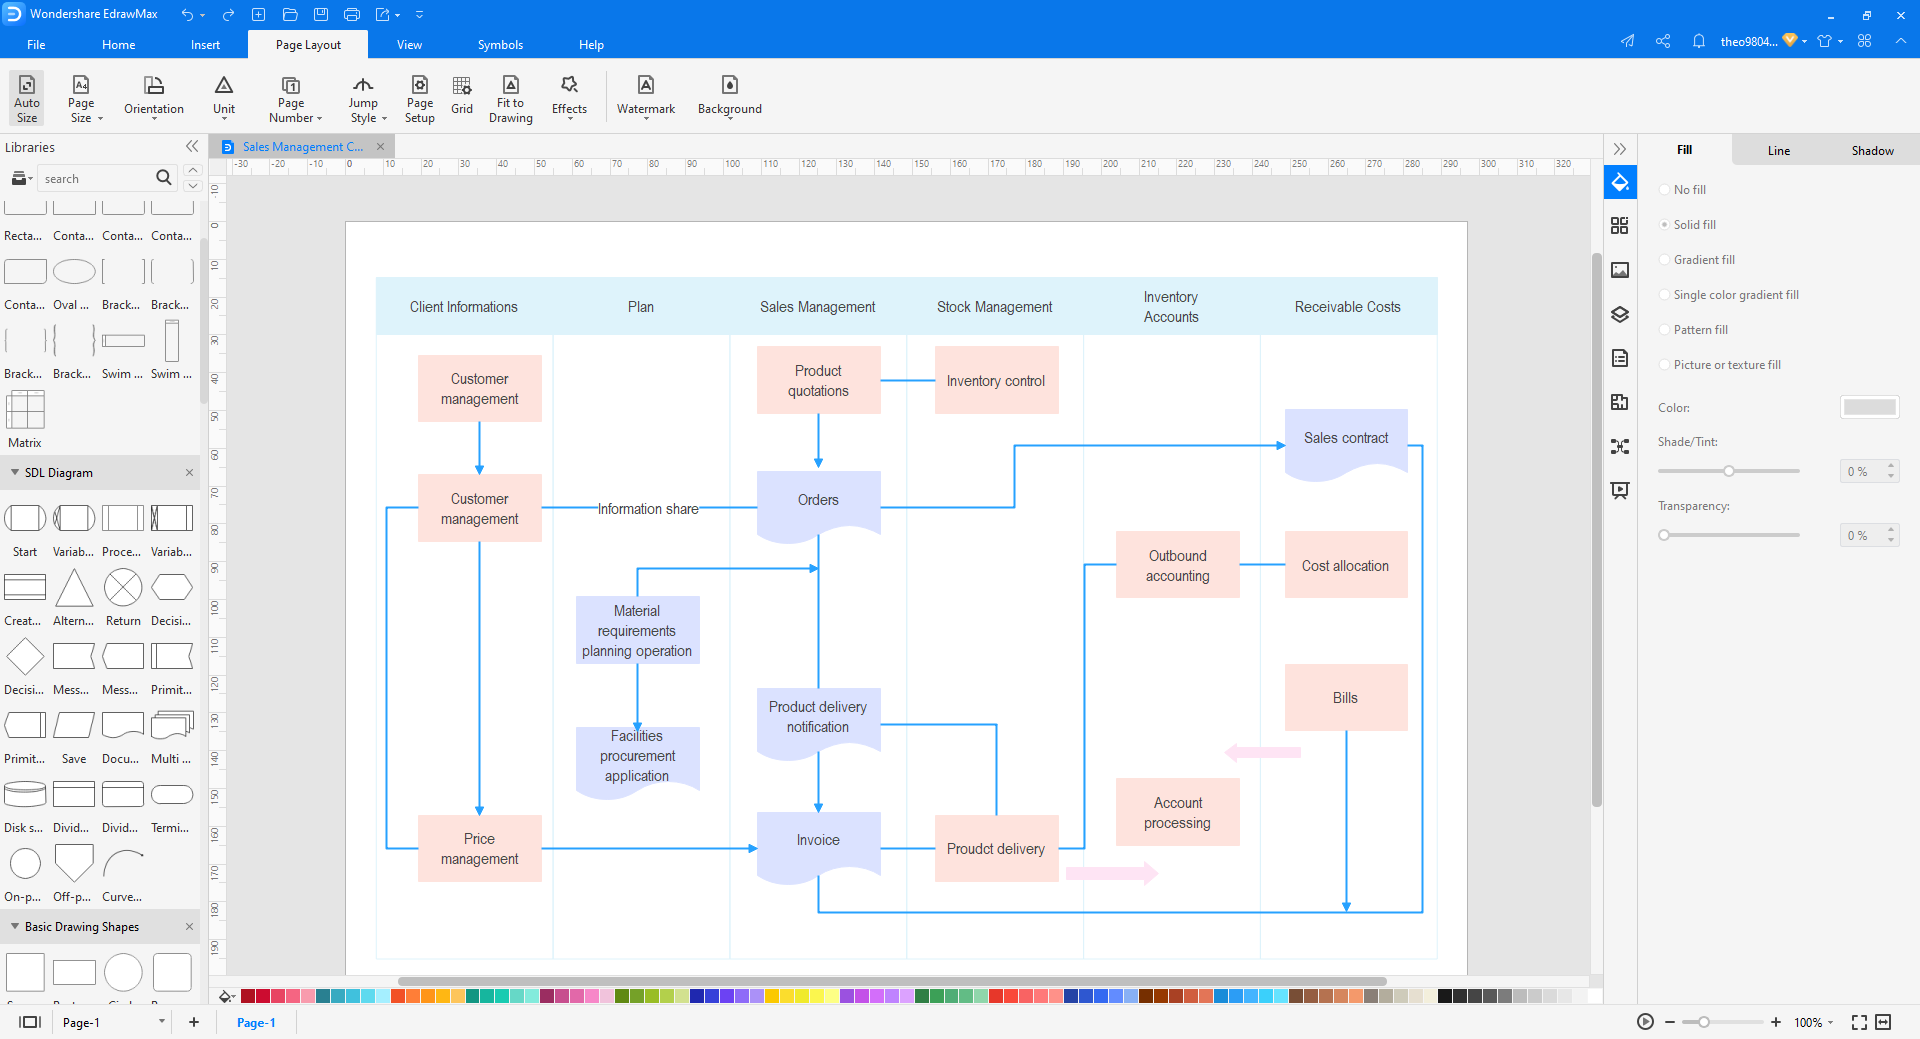
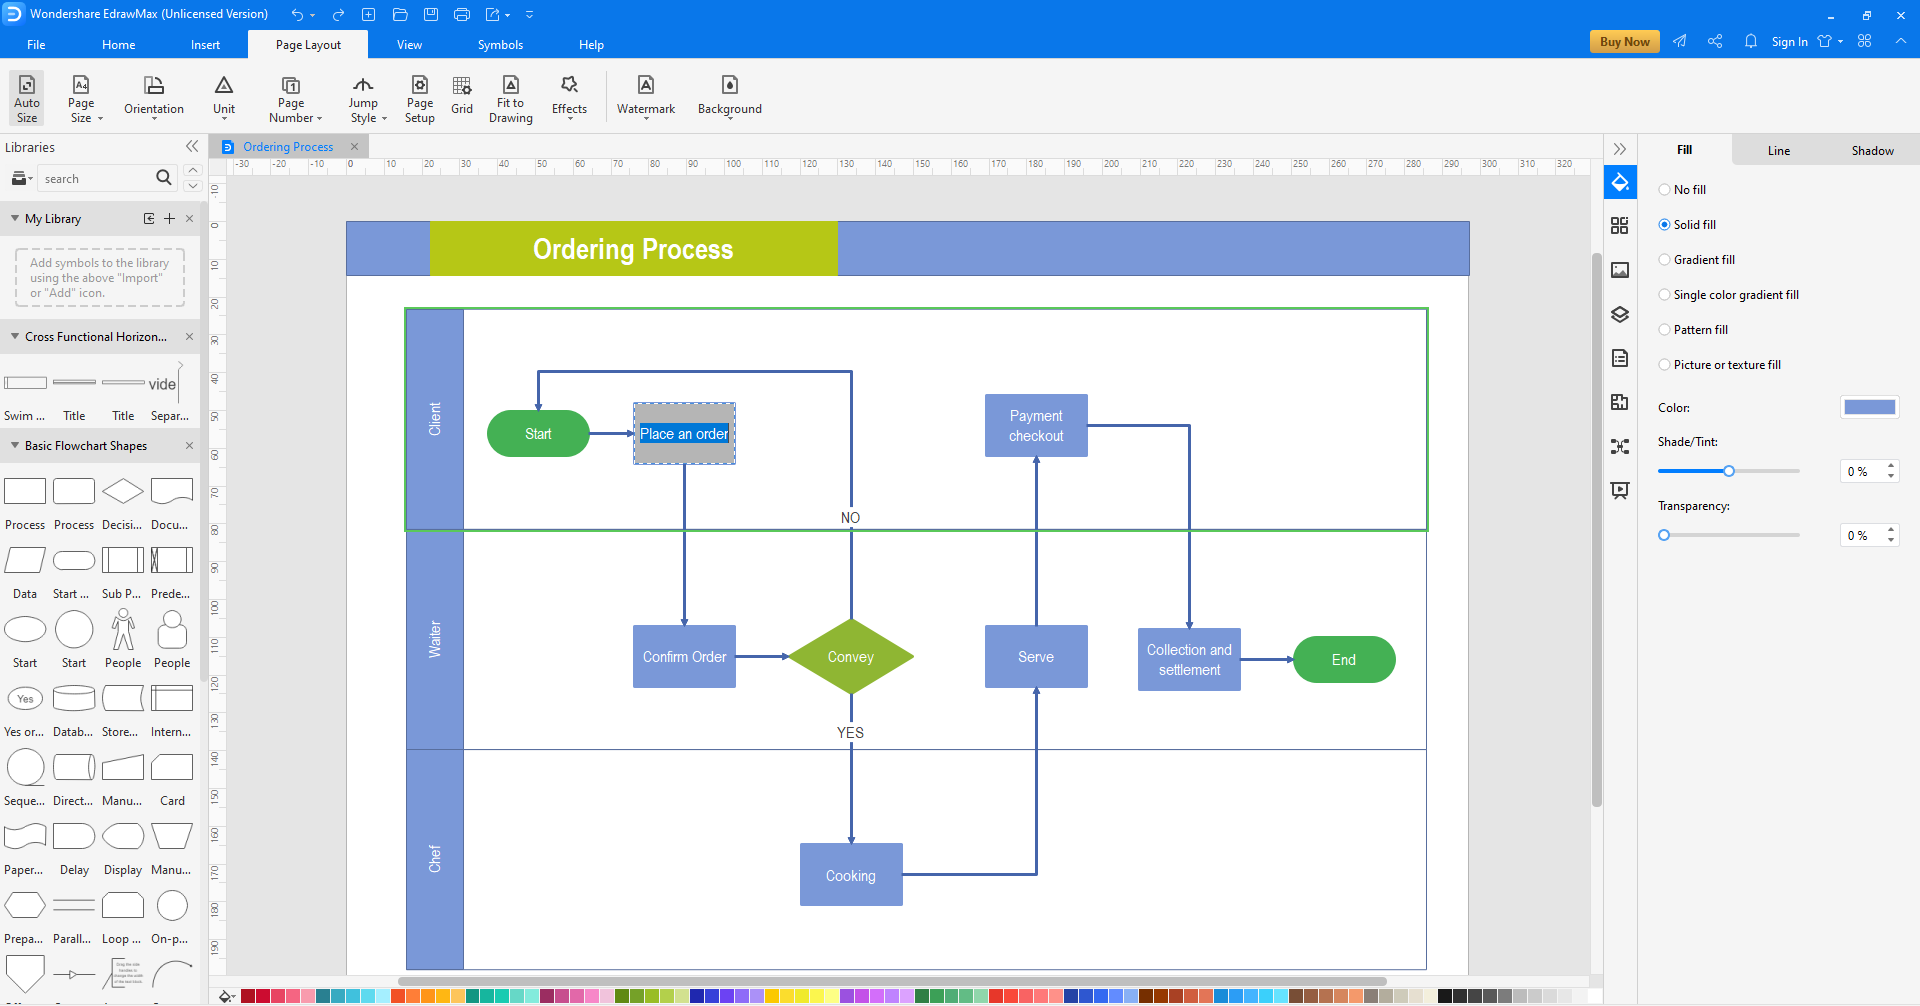
Step 2: Customize the Template
When the template chart opens up, double-click any of the available text boxes or column headers in the canvas (workspace), and change the text to best fit your requirements. You can also drag the additional shapes from the library on the left to the canvas and place them in your preferred location to make the chart more informative. The tools in the right pane can be used to format and decorate the shapes after selecting them on the canvas.
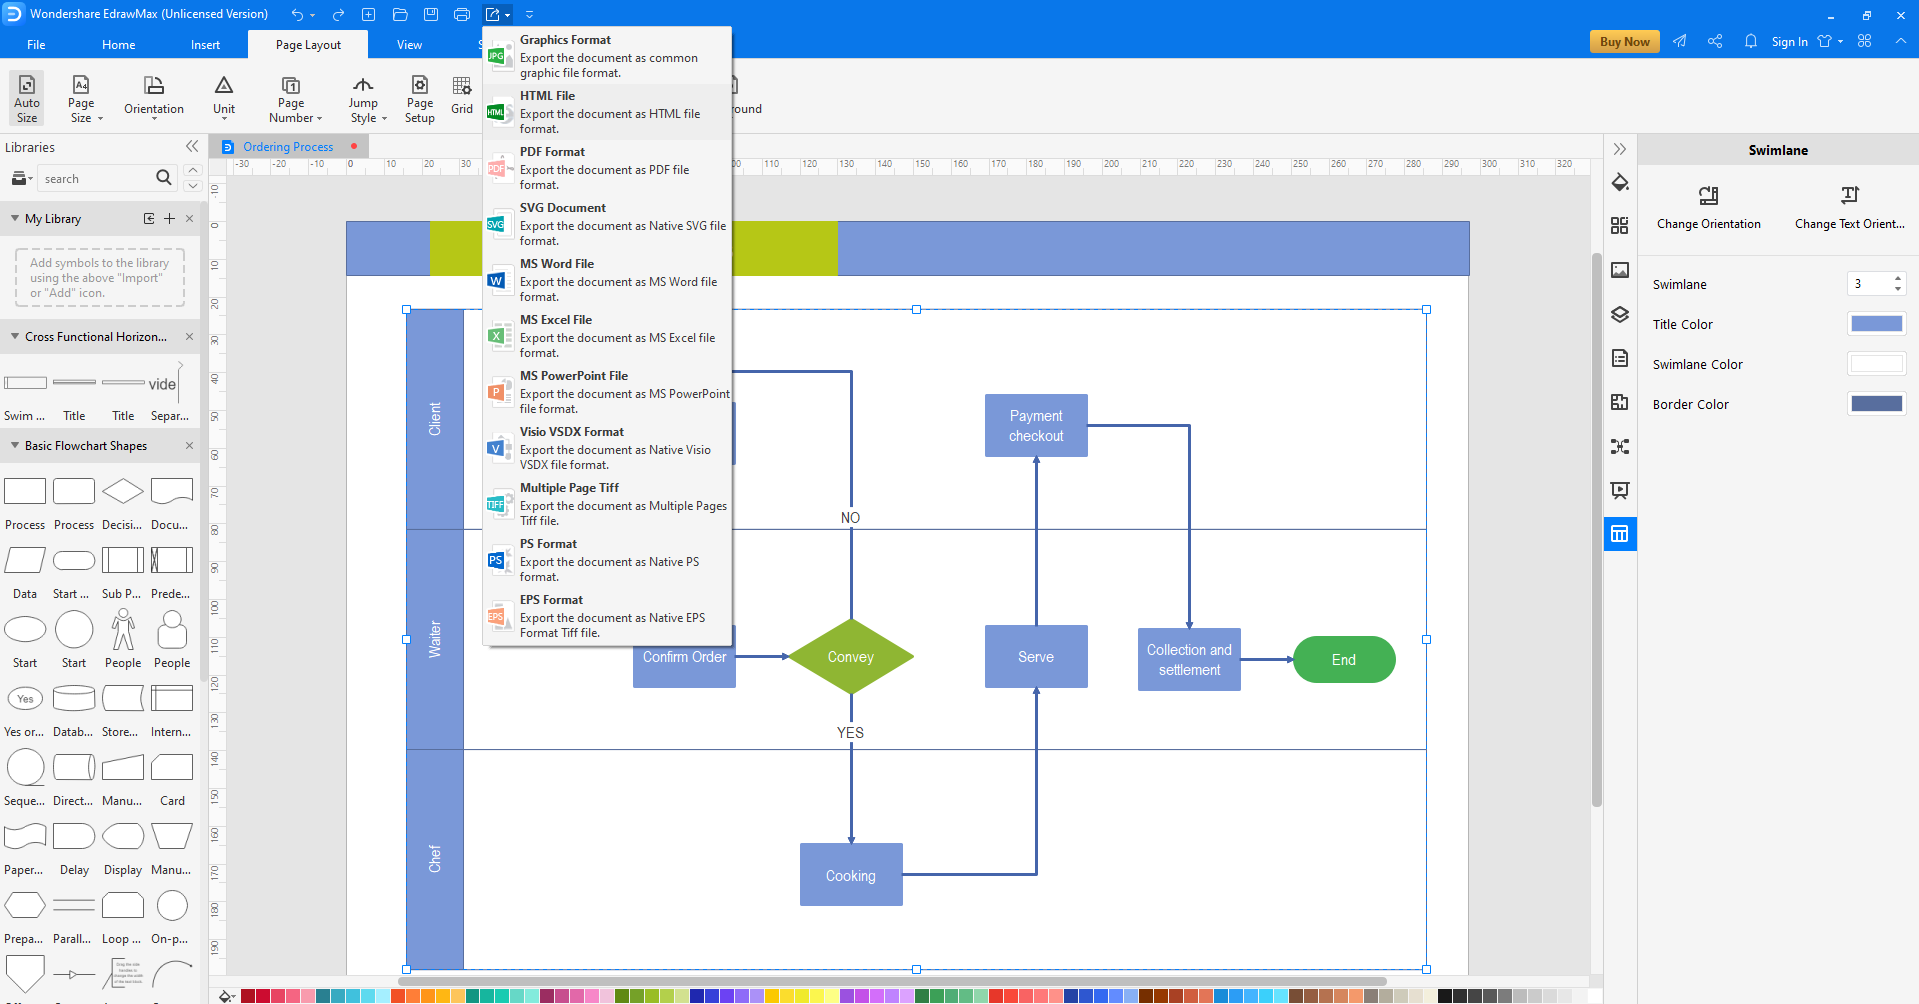
Step 3: Save and Export the Flowchart
Once the cross-functional flowchart is successfully created, you can click the Save icon from the quick access toolbar at the top to save the EdrawMax project file on your PC. For distribution and sharing, you can click the More option on the Export icon and choose your preferred format to export the flowchart to.
Tips for Making Cross-Functional Flowcharts
Although making a cross-functional flowchart is simple as long as you have a clear idea of what you want in your mind, a couple of pro tips listed below would certainly help you come up with a better, well-detailed design.
- Jot down the key elements on a piece of paper, and keep the sheet handy for reference while drawing the cross-functional flowchart
- Label the column headers and shapes correctly
- Add comments to the shapes wherever needed to specify what or who do they represent and what role has been assigned to them
- Feel free to add as many shapes as you want to make the chart as detailed as you possibly can
- Make sure to export the flowchart to the most acceptable format, and save the EdrawMax file as well, just in case you may want to make some changes to the diagram in the future
Cross-Functional Flowchart Example
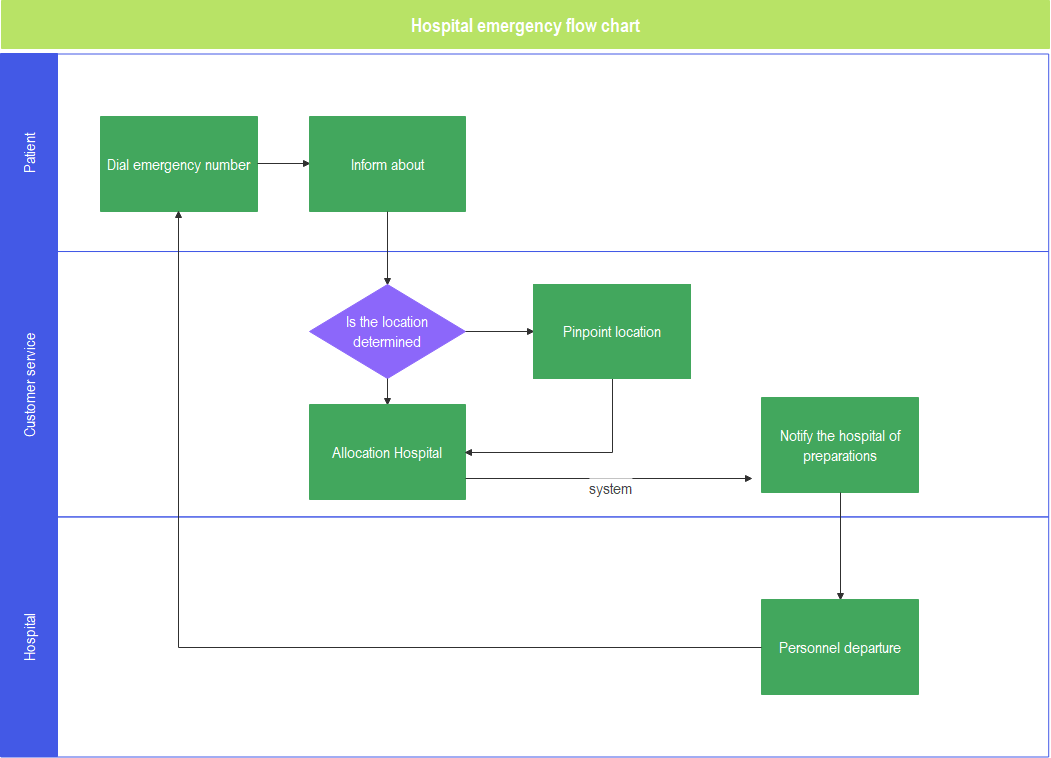
Even though almost everything about the cross-functional flowchart has been covered in the above sections, using an example to make things even clearer wouldn’t harm. Would it?
The above diagram indicates the entire process for ordering a meal at a restaurant. As you can notice, in the first phase, the client enters the premises and places an order. The second lane of the diagram is dedicated to the waiter, where he/she accepts and confirms the order and then conveys the message to the chef, who, in the diagram, is holding a place in the third lane. The chef starts cooking, and upon completion, hands over the meal to the waiter, who in return serves the food to the client. The client then makes the payment, the waiter collects it and settles the bill, after which the process ends.
The above diagram is nicely drawn and elaborates the entire ordering and payment process at a single glance, thus serving its purpose well.
Conclusion
Depending on the scale of the organization, according to the number of processes it performs and the type of business it is in, there could be one cross-functional flowchart or many. While preparing a decent diagram can be done manually, using an efficient tool like Wondershare EdrawMax is strongly suggested as it helps in preparing an error-free chart in a comparatively much lesser time.


