Trusted By Over 25 Million Users & Leading Brands

cmpa
mckesson
deloitte
amazon
facebook
apple
puma
nike
sony
pilz
ge
kpmg
fujifilm
mitsubishi_electric
ublox
daimler
toyota
walmart
harvard_university
glencore
at&t
amerisource_bergen
aramco
shell
total

Why EdrawMax to Make Your Scatter Plots?

Scatter plots for every need
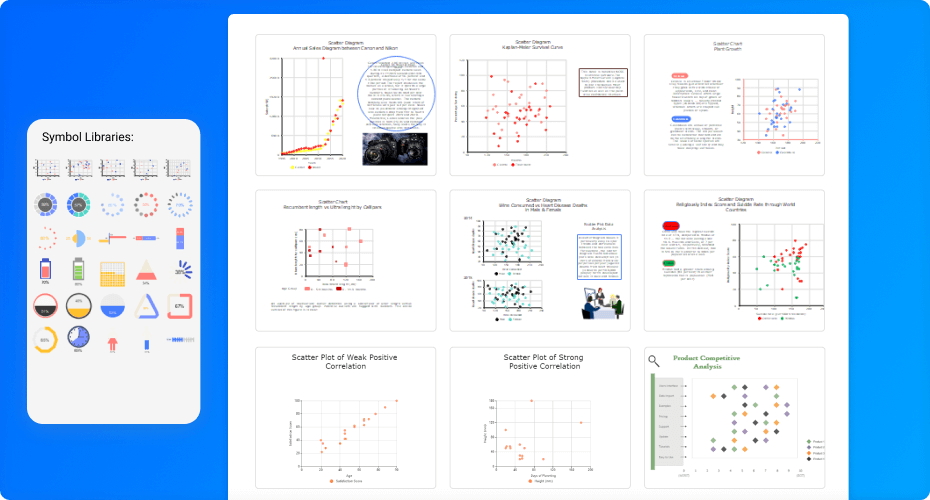
Relationship between variables: If you have multiple variables, you can use a scatter plot to show their relationship.

Data analysis: A scatter plot is an excellent way to explore data trends and patterns. Immediately after plotting data, you can see if your data is linear or if it is non-linear.

Statistics: Statistical data analysis can be done by looking at the data in a scatter plot. It is easy to spot outliers, as well as any possible correlations.

for every need

Creating scatter plots is a breeze
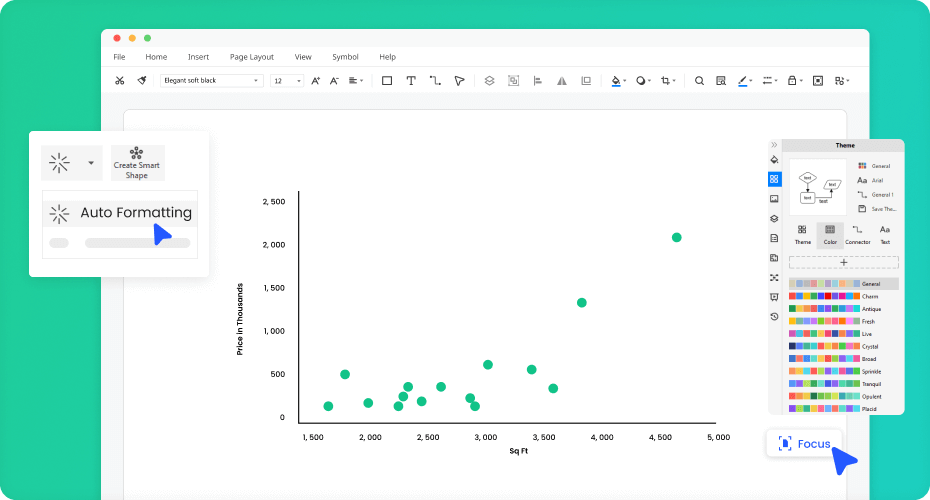
Professionally-designed templates: EdrawMax scatter plot maker offers a wide range of professional templates, making it easier to create professional-looking scatter plots.

Easy data import & export tools: EdrawMax supports importing chart data from CSV, TXT, etc. And EdrawMax has many of the best data export tools when completing charts and graphs.

Custom brand color palettes: It is possible to use the color palettes of your choice, such as your brand's colors or your favorite colors.

create with EdrawMax

Store and share with much ease

Enjoy free cloud storage: EdrawMax scatter plot maker will be able to generate a preview of your drawing for you automatically, and you can save your drawing in the cloud for easy access later.

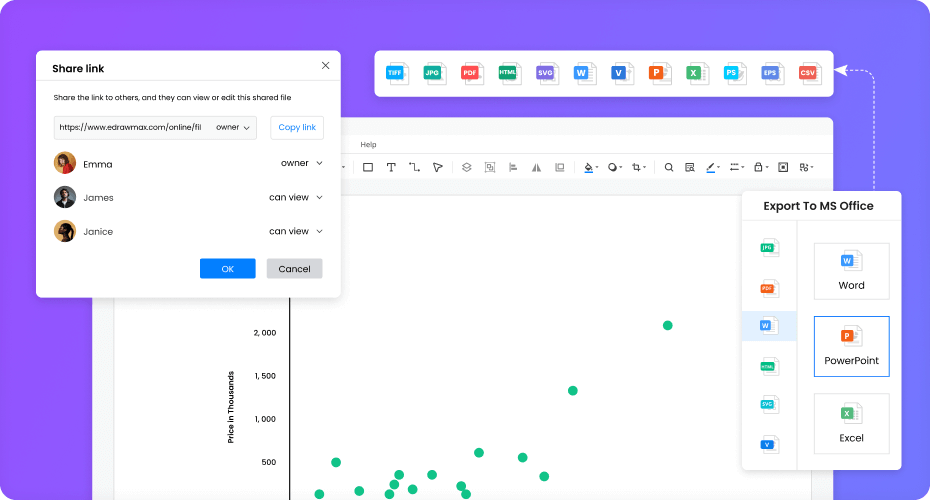
Multiple options for export: It is very easy to export the graph to the image format (PNG, JPG, BMP, etc.) and the Xlsx format through the multiple options in the Export menu.

Share with freinds & colleagues: You can share your new EdrawMax file with your friends and colleagues by sending them a link to the file or on the social media.

collaboration

Print, embed, and present without limit
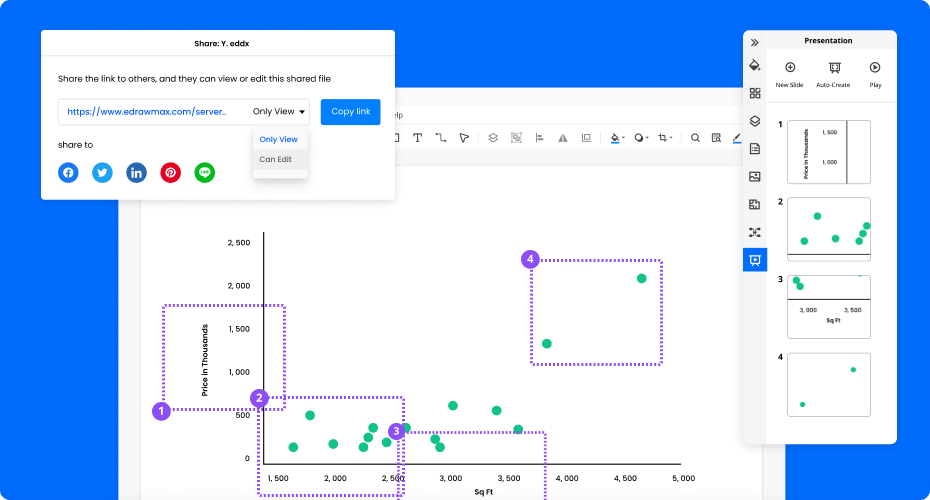
Excellent printing tools: EdrawMax has an integrated printing system. The user can choose to print a selected area, a single layer, or the entire canvas.

Easy to embed: With the ability to convert a graphic into an embedded image, EdrawMax can be easily embedded into any web page. Just drag and drop the graphic into the page.

User-friendly presentation: Drag the cursor to the important parts of the chart while presenting to explain the critical parts. You can also split the diagram into slides for a detailed presentation.

presentation

More Features Of Scatter Plot Maker

Visio files import and export
Customized fonts and shapes
Insert images and attachments
Infinitive canvas
Various color theme
File encryption and file backup

Compared to other scatter plot makers, this application is a great tool for creating scatter plots. This application is a wonderful tool for creating scatter plots with a great range of features. It is a tool for the creation of scatter plots. This application is a great tool for creating scatter plots, and it has a great range of features.

I was impressed by the feature set and the level of detail that EdrawMax provides. It has a lot of the features I would expect from a charting tool, and it does it in a way that's intuitive and easy to use. I especially like the ability to customize the charts and graphs to suit my needs. I didn't think there was anything else like it, but I was wrong. I'm very happy with the service, and I highly recommend it.

EdrawMax is one of those online tools that seem to pop up everywhere. They create beautiful charts and graphs to help you convey data in an easy-to-understand format, so you don't have to learn a lot about statistics to get your point across.

Edraw Scatter Plot Templates

Scatter Diagram
Scatter Diagram
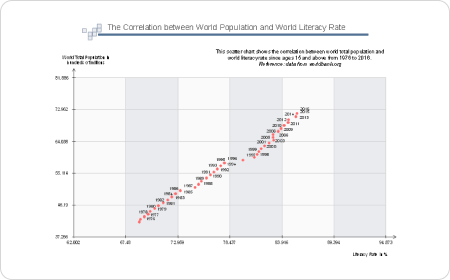
Scatter diagram is a popular way of visualizing the relationship between two variables. It allows you to quickly and easily identify any trends or patterns in the data.
Scatter Graph
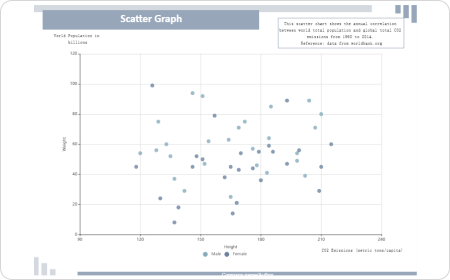
Scatter Graph
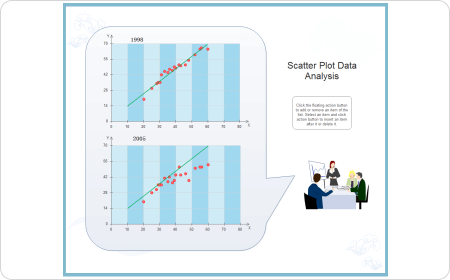
The scatter graph shows data points that represent the values of a variable. You can add a line between each point to make a trend line.
Scatter Chart
Scatter Chart
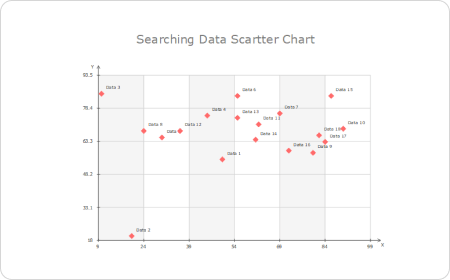
Students often find it difficult to make a good scatter plot. They often try to make a scatter plot by just using their imagination. EdrawMax scatter plot maker is here to help.
Scatter Plot Example
You can make your own scatter plot templates with the help of the EdrawMax scatter plot example.
Scatter Plot Correlation
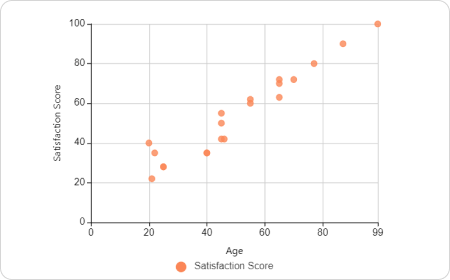
These scatter plots are based on a very simple correlation equation. The value of X is compared to the value of Y, and the value of X is plotted against the value of Y.
XY Chart
XY Chart
EdrawMax is a professional and free scatter plot creator that provides you with many professional chart templates. You can make an XY chart for your work and study.

Scatter Plot FAQs

Except for the pre-made scatter plot templates in EdrawMax, you can download and customize templates from our Template Community. All the community-made templates are free to use for Edrawers.
When your scatter plot is complete, you can post it on social media, publish on Edraw Template Community, or export the file as Word, Excel, PowerPoint, Visio, PDF, SVG, PNG and JPG. EdrawMax is dedicated to delivering a superior user experience.
No worries. You can find scatter plot symbols by opening and searching in the preset symbol libraries of EdrawMax.
You can create a scatter plot from scratch by dragging and dropping symbols from the libraries and customizing colors, fonts, lines, etc. All the symbols in EdrawMax are vector, editable, and catered to different types of scatter plots.
YES! It is free to create different scatter plots in EdrawMax. There are free templates, symbols, and easy-to-use editing tools for making scatter plots. Just download it and try EdrawMax now. You will love it right now.

More Resources

Unlock your diagram possibilities by exploring more diagram makers here.
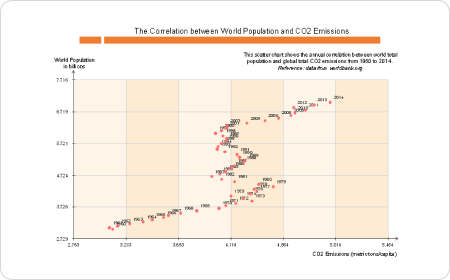
Find more ideas, tips and knowledge to help create scatter plots.
Need help? Find the instruction or contact support here.