Flowchart Symbols and Their Usage
Edraw Content Team
Do You Want to Make Your Flowchart?
EdrawMax specializes in diagramming and visualizing. Learn from this article to know everything about flowchart symbols, and how to use flowchart symbols. Just try it free now!
Flowchart symbols are organizational tools that help us to show the relationship between two things. A typical example might be the way a car works. Here, we have two items that are related. In this case, it's gas and engine speed. We use a circle to represent the gas tank and a line to represent the engine. The engine speed increases as the gas are put in the car. To clarify this, we could use another line from where the gas is put to the point where the engine is running. Flowcharts are so helpful that even a person without experience in graphics can quickly learn to use them.
1. What Are the Flowchart Symbols
Flowchart symbols can show the flow and logic between ideas and concepts. Some symbols are used in writing, some in print, and some in advertising. Flowcharts can be used in the following contexts: to depict the process a company follows to create its products, to provide information about the history of a company, to explain the organizational structure, and to outline the main steps of an activity.
These days flowcharts are used to show process flow or data flow diagrams. The origins of flowcharts can be traced back to the 1950s with the works of Alonzo Edensor, who invented the first system for graphically representing and editing business processes. Before that, various attempts were made by multiple engineers and scientists to create graphic models of human processes, but Edensor took the concept a step further, using graphic representation for communication.
Flowchart symbols can show the flow and logic between ideas and concepts.
2. Flowchart Symbols (Different Types)
The sole purpose of the given list of flowchart symbols in different types is to give you some common flowchart symbols and provide an overview of their meanings. Different types of flowchart symbol convey different information. They are arranged in no particular order. They are meant to be useful for anyone who needs to use flowcharts in any software project. The symbol names are used in the listings here, but you can use any of your names if you want.
- 5 Basic Flowchart Symbols
- Process/Operation Symbols
- Branch and Control of Flow Symbols
- Input and Output Symbols
- Data and Information Storage Symbols
- Data Processing Symbols
- Cross-Functional Flowchart Symbols
- Workflow Diagram Symbols
- Audit Flowchart Symbols
- BPMN Flowchart Symbols
- Data Flow Diagram Symbols
- Event Flow Diagram Symbols
- IDEF Symbols
- SDL Diagram Symbols
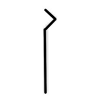
2.1 5 Basic Flowchart Symbols
There are various flowchart shapes used for drawing different types of flowcharts. Each flowchart symbol has its own meaning and context where it is used appropriately. However, whether you want to read a flowchart or try to make one by yourself, knowing the common symbols and what they represent will make things easier. Here, you will see the 5 flowchart symbols that are very popular and commonly used in almost every flowchart.
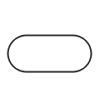
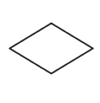
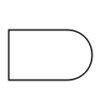
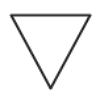
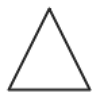
- The Oval or Pill Shape represents the start/end.
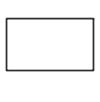
- The Rectangle Shape represents a process.
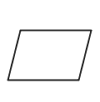
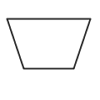
- The Parallelogram Shape represents the input/output of the information.
- The Diamond Shape represents a decision.
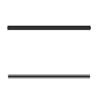
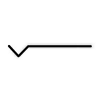
- The Arrow Shape represents the flow of the sequence.
Source: EdrawMax
2.2 Process/Operation Symbols
Process/Operations Flowchart Symbols are great for describing the flow of operations. A well-designed flowchart shows the process from start to finish. Process flow charts show you the overall processes which should be executed to reach a particular goal. In case you have a process flow chart, and you don't know which symbols to choose, you can use these given symbols for your processing and output tasks.
- Process Symbol: Also known as action symbol. Represents a step in your process.
- Sub Process Symbol: Represents a sequence of actions that perform specific tasks within a larger and more complicated process, routine, or module.
- Predefined Process Symbol: Indicates a set of steps that combine to create a complicated process that is defined elsewhere, often on another page of the same drawing.
- Delay Symbol: Represents a delay in the process. In Process Mapping, delays are often important as they may result in adding to the cost of the product or simply delaying its production.
- Preparation Symbol: Indicates the set-up to another step in the same process.
- Manual Operation Symbol: Represents a process step that should be performed manually, not automatically.
- Parallel Mode Symbol: Also called "Concurren opeartion". Indicateds two or more simultaneous operations or process steps.

Source: EdrawMax
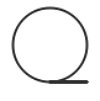
2.3 Branch and Control of Flow Symbols
These branching controls determine whether a decision will be made later in the process. They are often represented by an arrow that can turn left or right. Control flow charts describe complex logical problems, such as decision-making, algorithms, or other methods used to solve the problem. The control flow chart gives a graphical representation of the algorithm that solves a problem.
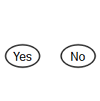
- Decision Symbol: Indicates a point where the outcome of a decision dictates the next step. There can be multiple outcomes, but often there are just two - yes and no.
- On-Page Reference: Use this symbol to connect separate processes on the same page of your flowchart.
- Off-Page Reference: Also known as off-page connector or link symbol. Use this symbol to connect separate processes across different pages with the page number written on or within the shape.
- Merge Symbol: Indicates that multiple processes or pathes are combined into one.
- Extract Symbol: Indicates that a process splits into parallel paths.
- Or Symbol: Indicates that the process flow diverges for more than 2 branches.
- Summing Junction Symbol: Indicates that multiple branches converge into a single process.
- Control Transfer Symbol: Indicates a process step that must go to one step other than the typical next step, when specific conditions are met.
- Annotation Symbol: Indicates additional information about a step in the flowchart.


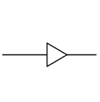
Source: EdrawMax
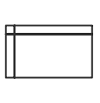
2.4 Input and Output Symbols
These flowchart symbols describe a sequence of processes that transform input into output. A Flowchart uses Input and Output symbols to show the beginning and end of each process in the order they should be executed. A Flowchart can represent an automated or manual procedure and can include sub-processes. It can even include the use of the term "Sub-Process."
- Data(Input/Output) Symbol: Indicates that information is coming into the process from outside, or leaving the process.
- Document Symbol: Represents the data that can be read by people, such as a printed document or report.
- Multi-Documents Symbol: Represents multiple documents in the process.
- Display Symbol: Indicates where the information will be displayed within a process flow.
- Manual Input Symbol: Indicates a process step where a user/operator is prompted to enter information manually.
- Card Symbol: Indicates that data is input by using cards. But this symbol is seldom used now.
- Paper Tape Symbol: Indicates that data is stored on page tapes. But this symbol is also rarely ever used now.
Source: EdrawMax
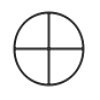
2.5 Data and Information Storage Symbols
The data may be in the form of structured information, unstructured information, raw data, or information in a digital format. The different types of information can be stored in databases, text files, spreadsheets, or a combination. The main difference between structured and unstructured data is that the latter is not organized in a predefined way. Here we will use simple pictures to explain some common symbols used in data visualization and information storage.
- Stored Data Symbol: Also known as data storage symbol. Use this symbol to indicates where data get stored.
- Database Symbol: Represents data/information stored in the storage device that allows for searching and sorting by users.
- Internal Storage Symbol: Usually used in the software design flowcharts and indicates that data/information is stored in memory during a program.
- Sequential Data Symbol: Represents the data that is accessible sequentially. The shape is supposed to look like a reel of tape.
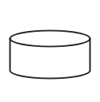
Source: EdrawMax
2.6 Data Processing Symbols
Data processing symbols are used to communicate data flow processes among people who may be working with computers but not computers themselves. People use data-processing symbols to communicate what they want and what will happen next. These diagrams help communicate process information in a concise way and in assisting others to understand the methods involved.
- Collate Symbol: AIndicates a process step that organizes data, information or materials into a standard format.
- Sort Symbol: Indicates a process step that organizes ata, information or materials into some pre-defined order.


Source: EdrawMax
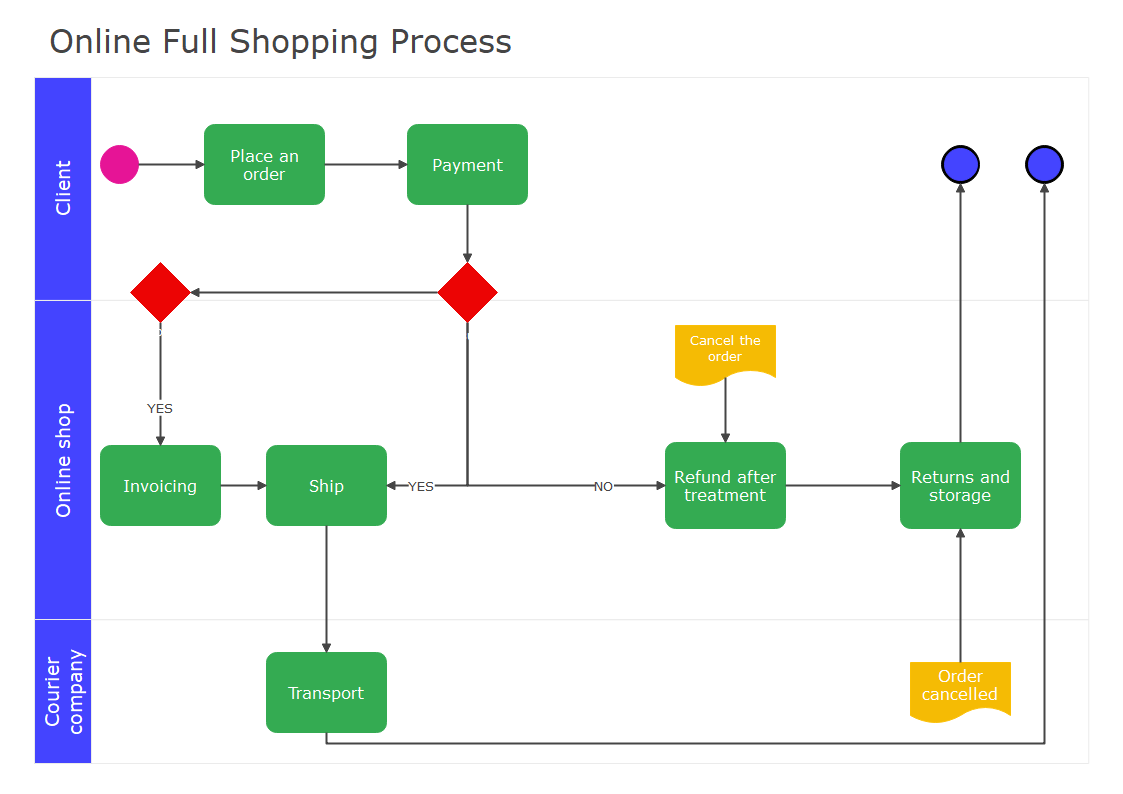
2.7 Cross-Functional Flowchart Symbols
A flowchart is described as "cross-functional" when the page is divided into different "lanes," describing the control of various organizational units. A unit appearing in a particular "lane" is within the power of that organizational unit. This technique allows the analyst to locate the responsibility for performing an action or making a decision correctly, allowing the relationship between different corporate groups with responsibility for a single process.
Source: EdrawMax
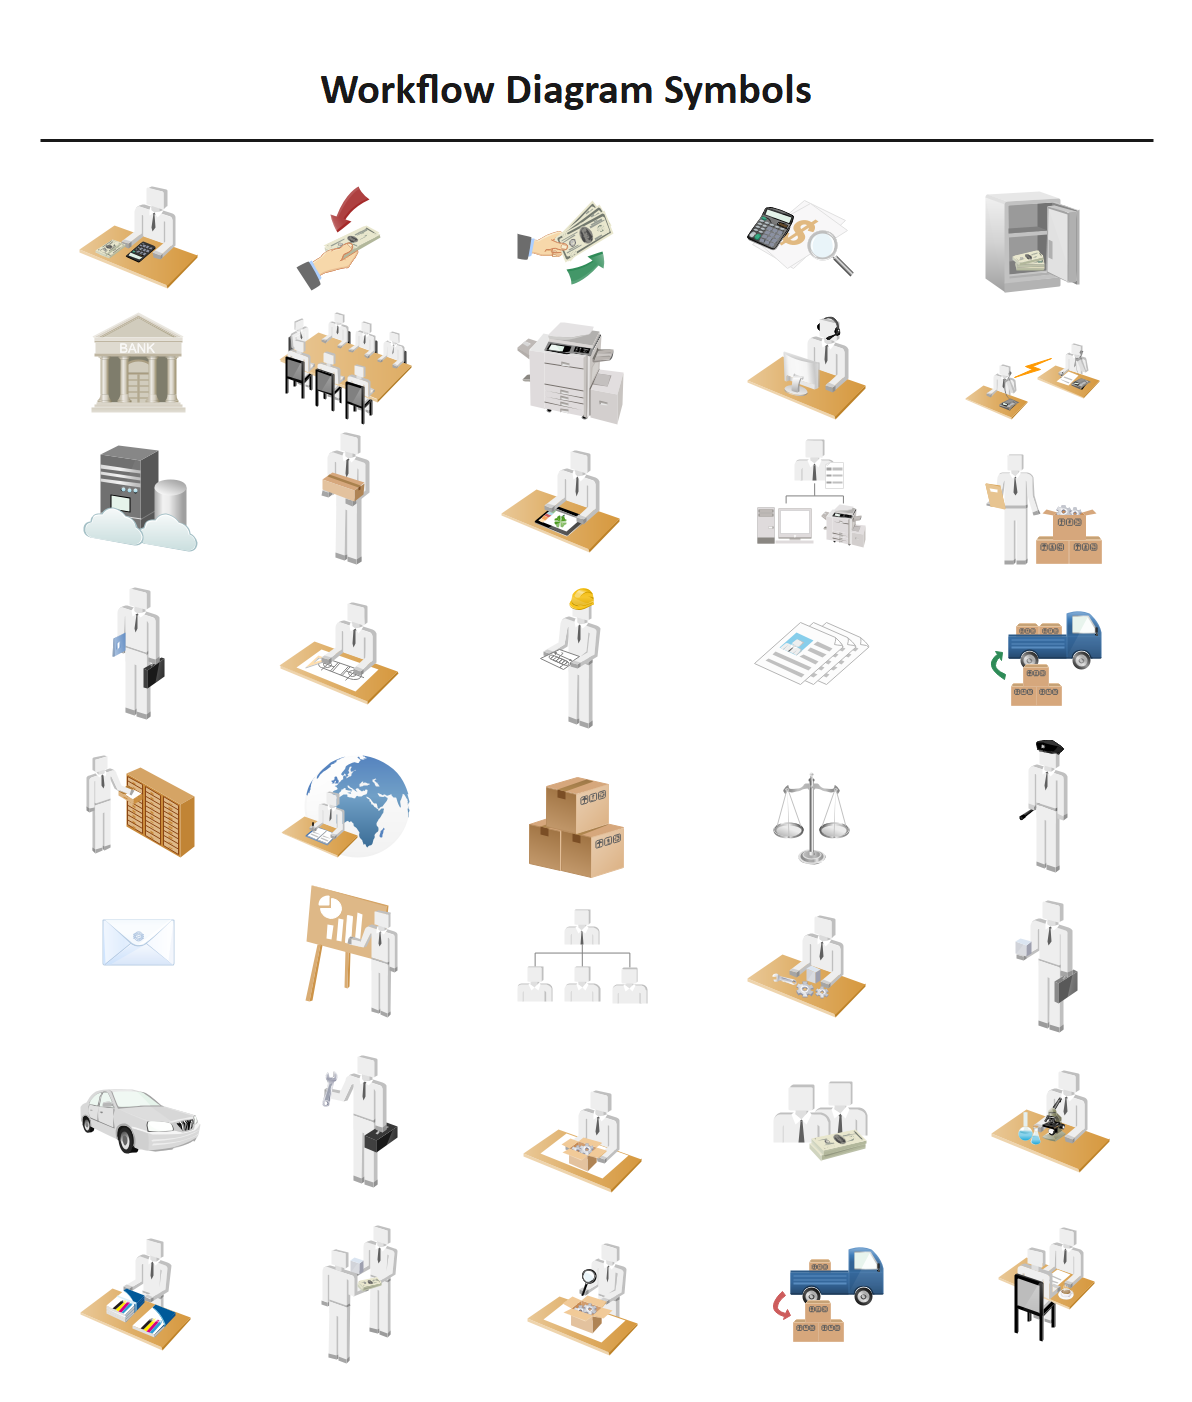
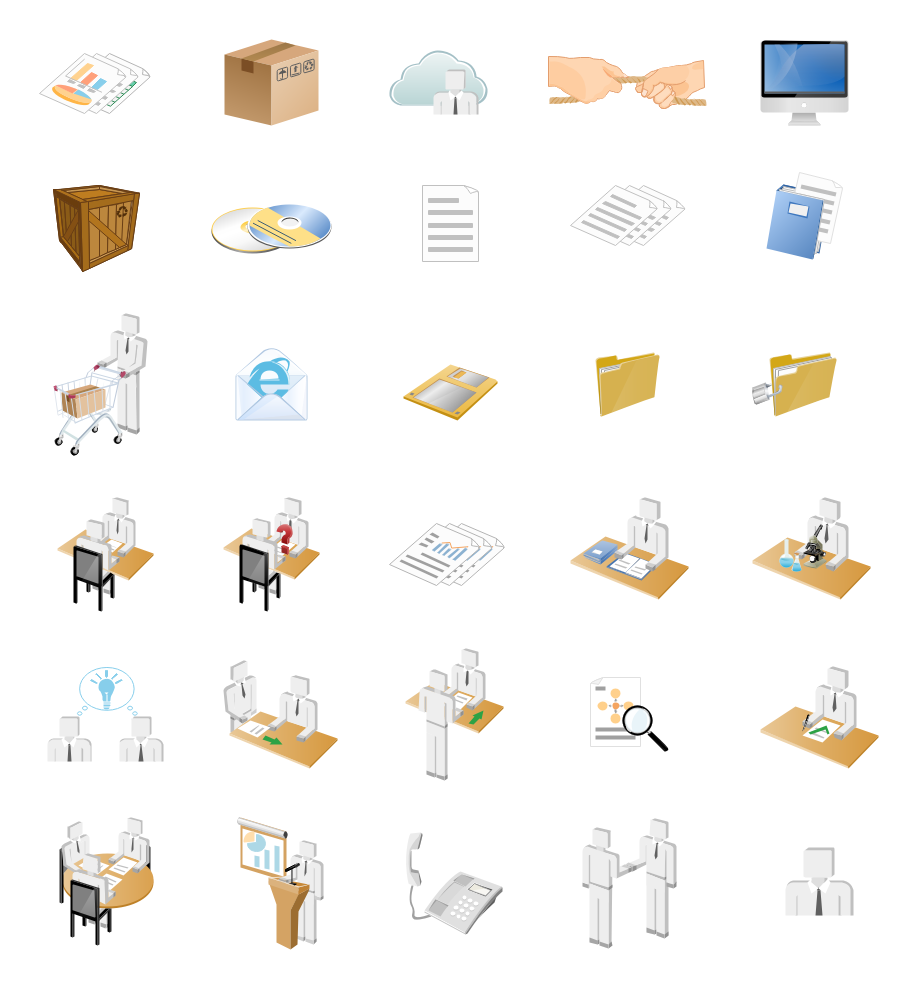
2.8 Workflow Diagram Symbols
A workflow diagram shows the relationships among different departments in a fixed work sequence, which means that one department needs to finish its job, so another department can continue the rest. As the workflow shows how your work is completed from start to finish step by step, the development and maintenance of these workflow relationships are very important for managers. Because by seeing how the business works from a top-down perspective, you can identify it’s potential flaws, weaknesses, and areas for improvement.
If you want to use these templates, you can click to download them. While The eddx file need to be opened in EdrawMax. If you don’t have EdrawMax yet, you could download EdrawMax for free!
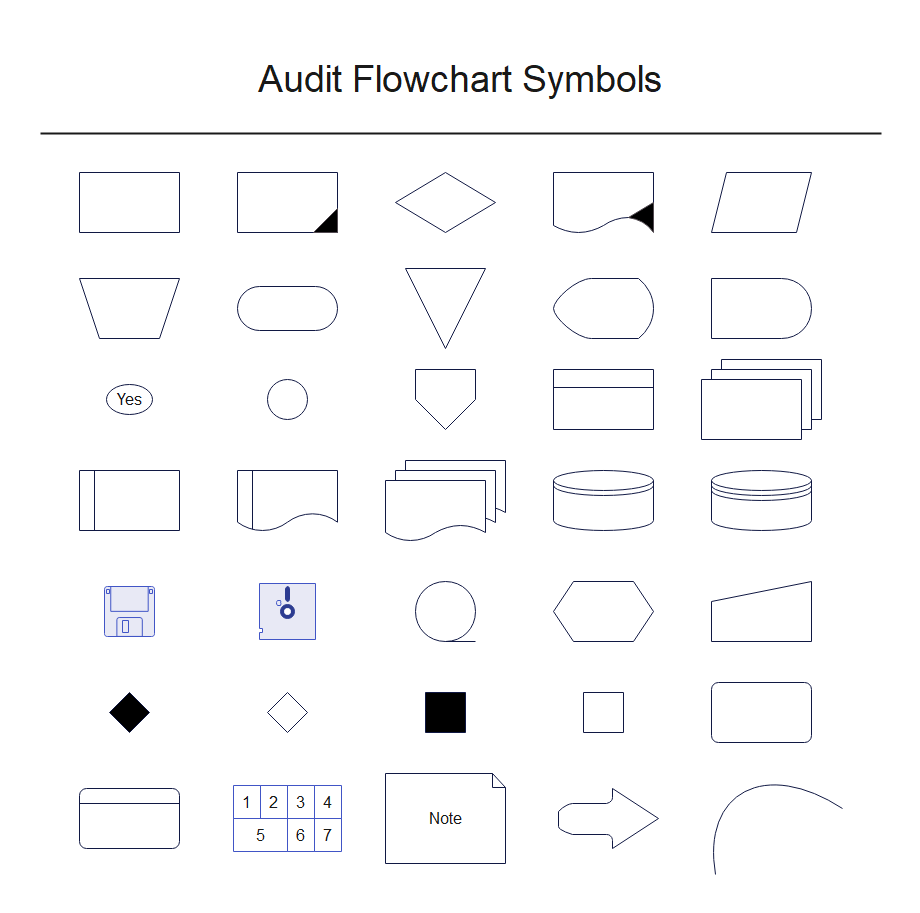
2.9 Audit Flowchart Symbols
The following shapes are similar to the basic flowchart symbols but are specially used in the audit flowchart. And you can learn more audit flowchart knwoledge here.
You can click to get these symbols' template, and use it in EdrawMax for free!
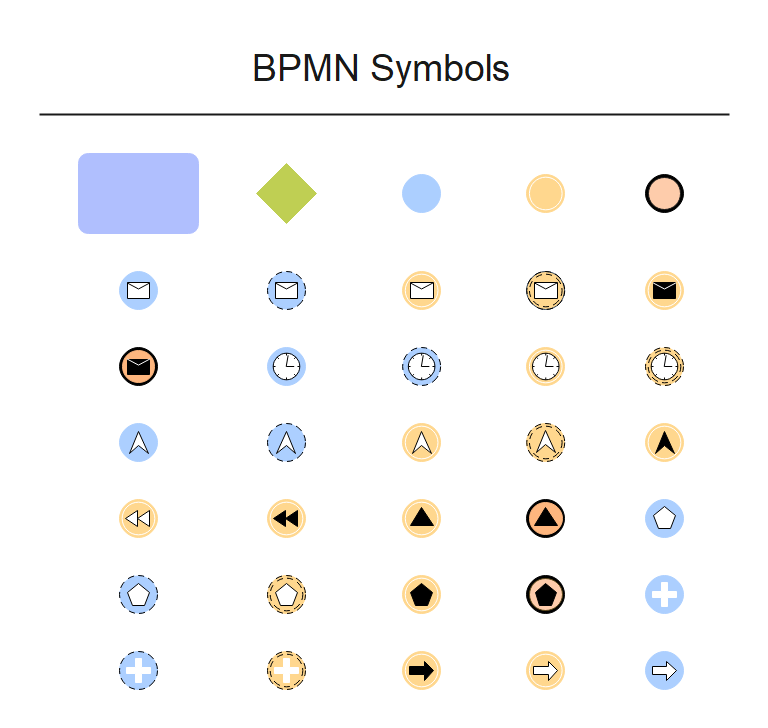
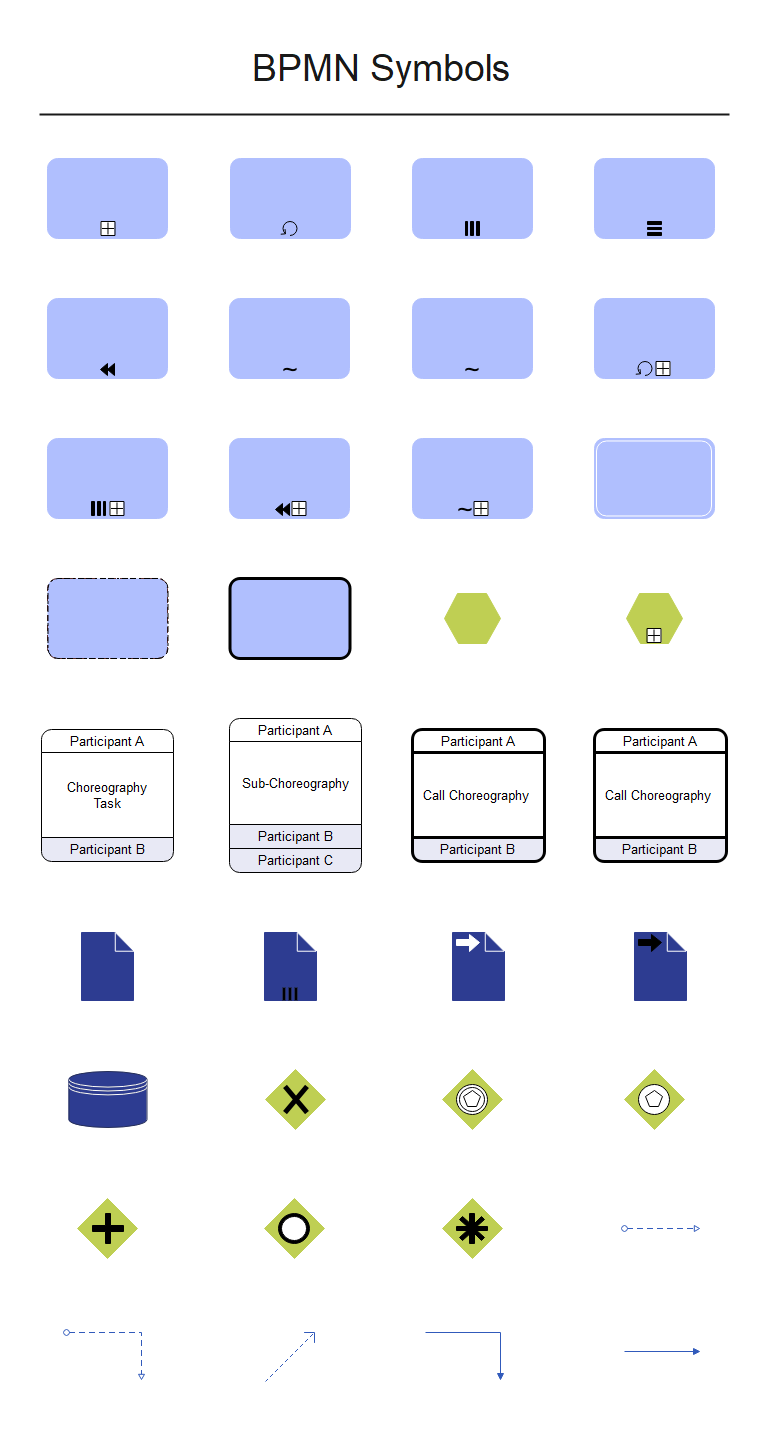
2.10 BPMN Symbols
Pre-drawn BPMN symbols represent the start message, the throwing message, the start timer, and so on. These symbols aid in the creation of accurate diagrams and documentation. There are more BPMN knwoledge for you to learn.
You can click to get these symbols' template, and use it in EdrawMax for free!
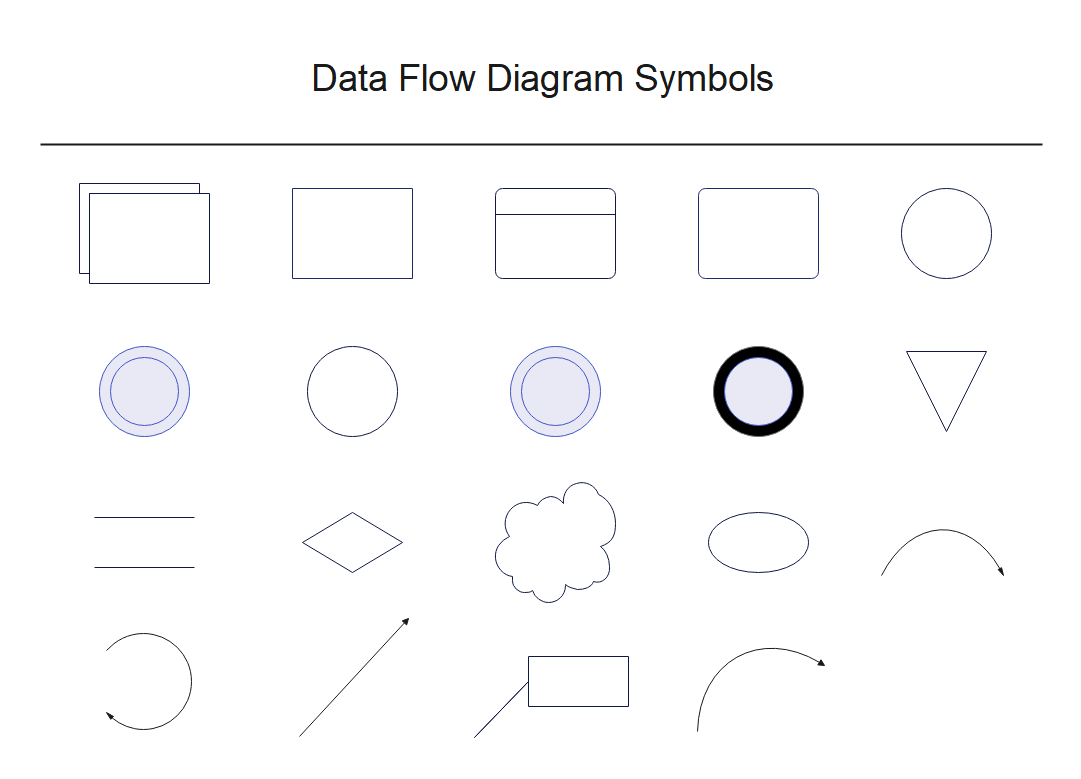
2.11 Data Flow Diagram Symbols
The data flow diagram depicts the flow of data. Data flow diagram shapes include data process, center to center, multiply process, loop on center, data store, line curve connector, and others. There are more Data Flow Diagram knwoledge for you to learn.
You can click to get these symbols' template, and use it in EdrawMax for free!
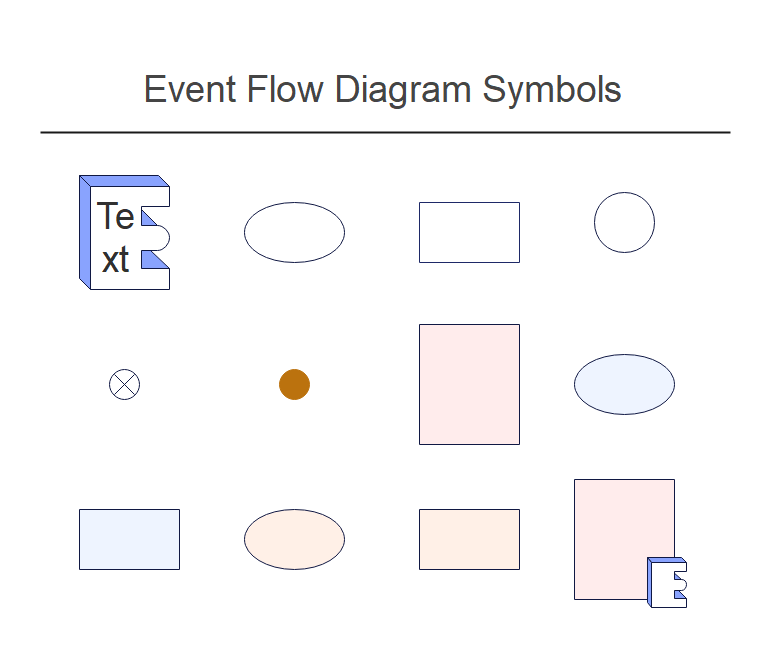
2.12 Event Flow Diagram Symbols
Event flow diagram symbols in popular vector format help create professional-looking diagrams and documentation. There are more Event Flow Diagram Symbols knwoledge for you to learn.
You can click to get these symbols' template, and use it in EdrawMax for free!
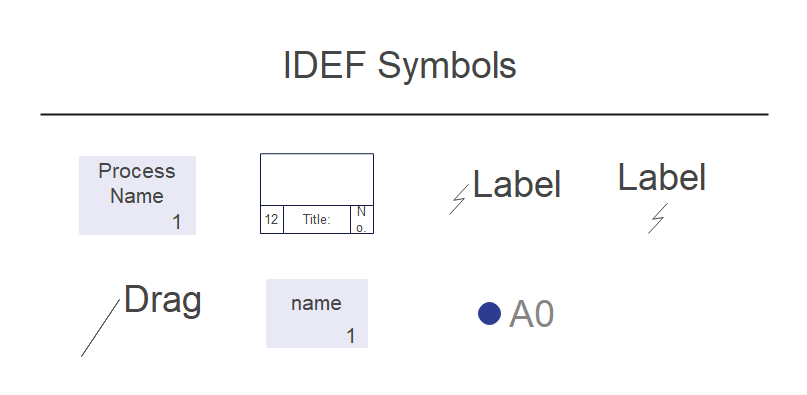
2.13 IDEF Symbols
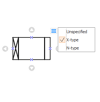
Special shapes, process flow, title block, N-type line, text block, 1 legged connector, forking connector, joint connector, bend connector, swing connector, node, solid connector, IDEFO connector, side text callout, and so on are all available in IDEF diagram symbols. There are more IDEF knwoledge for you to learn.
You can click to get these symbols' template, and use it in EdrawMax for free!
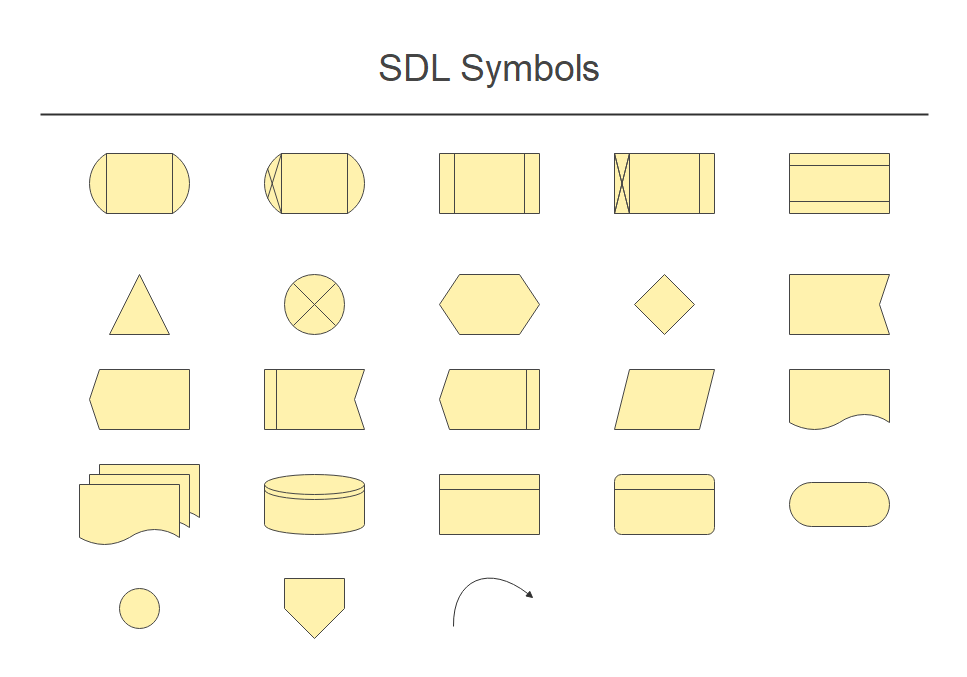
2.14 SDL Symbols
SDL diagrams are a type of diagram in which the graphical components of Specification and Description Language (SDL) are used to design object-oriented diagrams, model state machines in the communication, telecommunications, aviation, automotive, and medical industries, and create specifications and descriptions of behavior, data, and inheritance for interactive real-time systems, reactive systems, and distributed systems. There are more SDL Symbols knwoledge for you to learn.
You can click to get these symbols' template, and use it in EdrawMax for free!
3. Where to Find Flowchart Symbols
It would help if you had proper flowchart symbols to create an accurate flowchart access plan with details and a clear representation of each component. You can easily find flowchart symbols in the symbol library of EdrawMax.
You can easily find flowchart symbols in the symbol library of EdrawMax. EdrawMax gives you more than 26000 symbols that you can use to create a Flowchart or any other diagram. You can go and search for the symbols you want in EdrawMax and click on the Flowchart. Go to the flowchart category and use a simple drag and drop to add any symbol you want.
EdrawMax is the best resources for flowchart symbols, you can find hundreds of flowchart symbols here. Just drag and drop, you can create Flowchart easily.

An all-in-one platform for 210+ diagrams.
・ Simple alternative to Visio
・ 26k+ symbols
・ 10K+ free templates
・ 10+ AI diagram generators


4. How to Use Flowchart Symbols
You can download EdrawMax and follow these instructions to learn how to use flowchart symbols and easily create more flowchart symbols with EdrawMax.
4.1 How to Use Flowchart Symbols in EdrawMax
Instead of wasting time drawing the flowchart symbols or icons on paper, you should look for a way to design a Flowchart easily. EdrawMax is well equipped to design a Flowchart.
Step1 Login EdrawMax
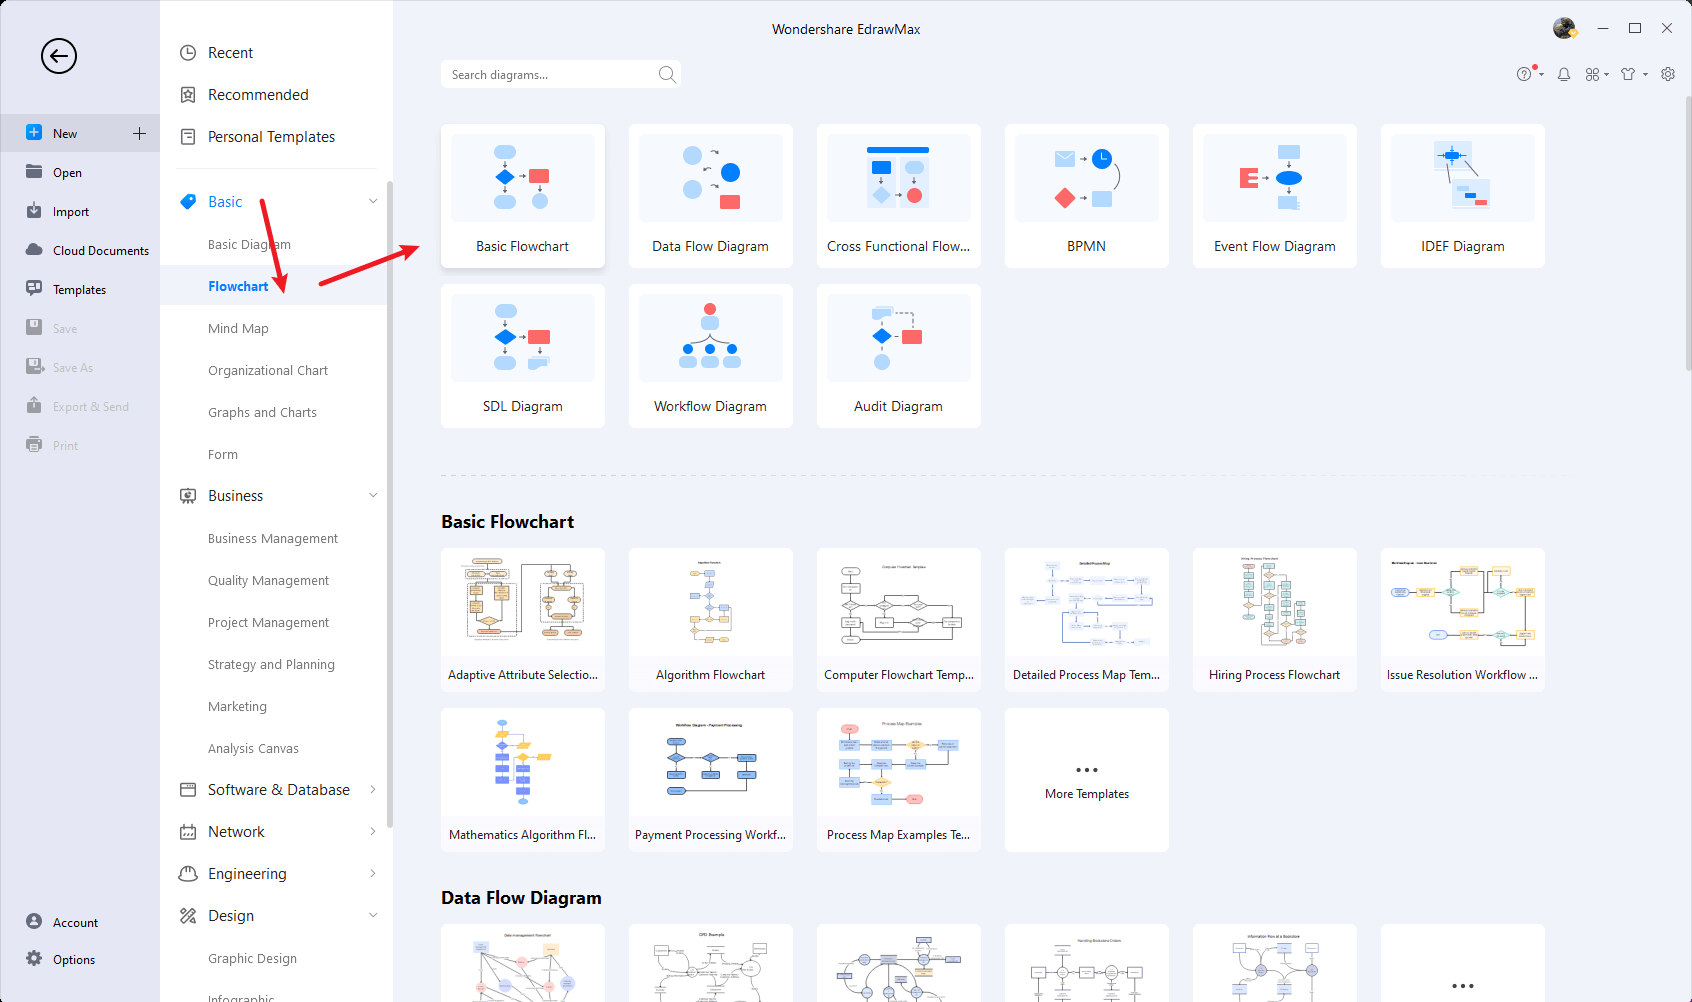
If you are new here, you should use your Email to register EdrawMax, but if you're already the EdrawMax's user, you just need to login EdrawMax for free. Open EdrawMax select "Basic", and click "Flowchart", then open a new canvas or just open a built-in template.
Step2 Select Flowchart Symbols
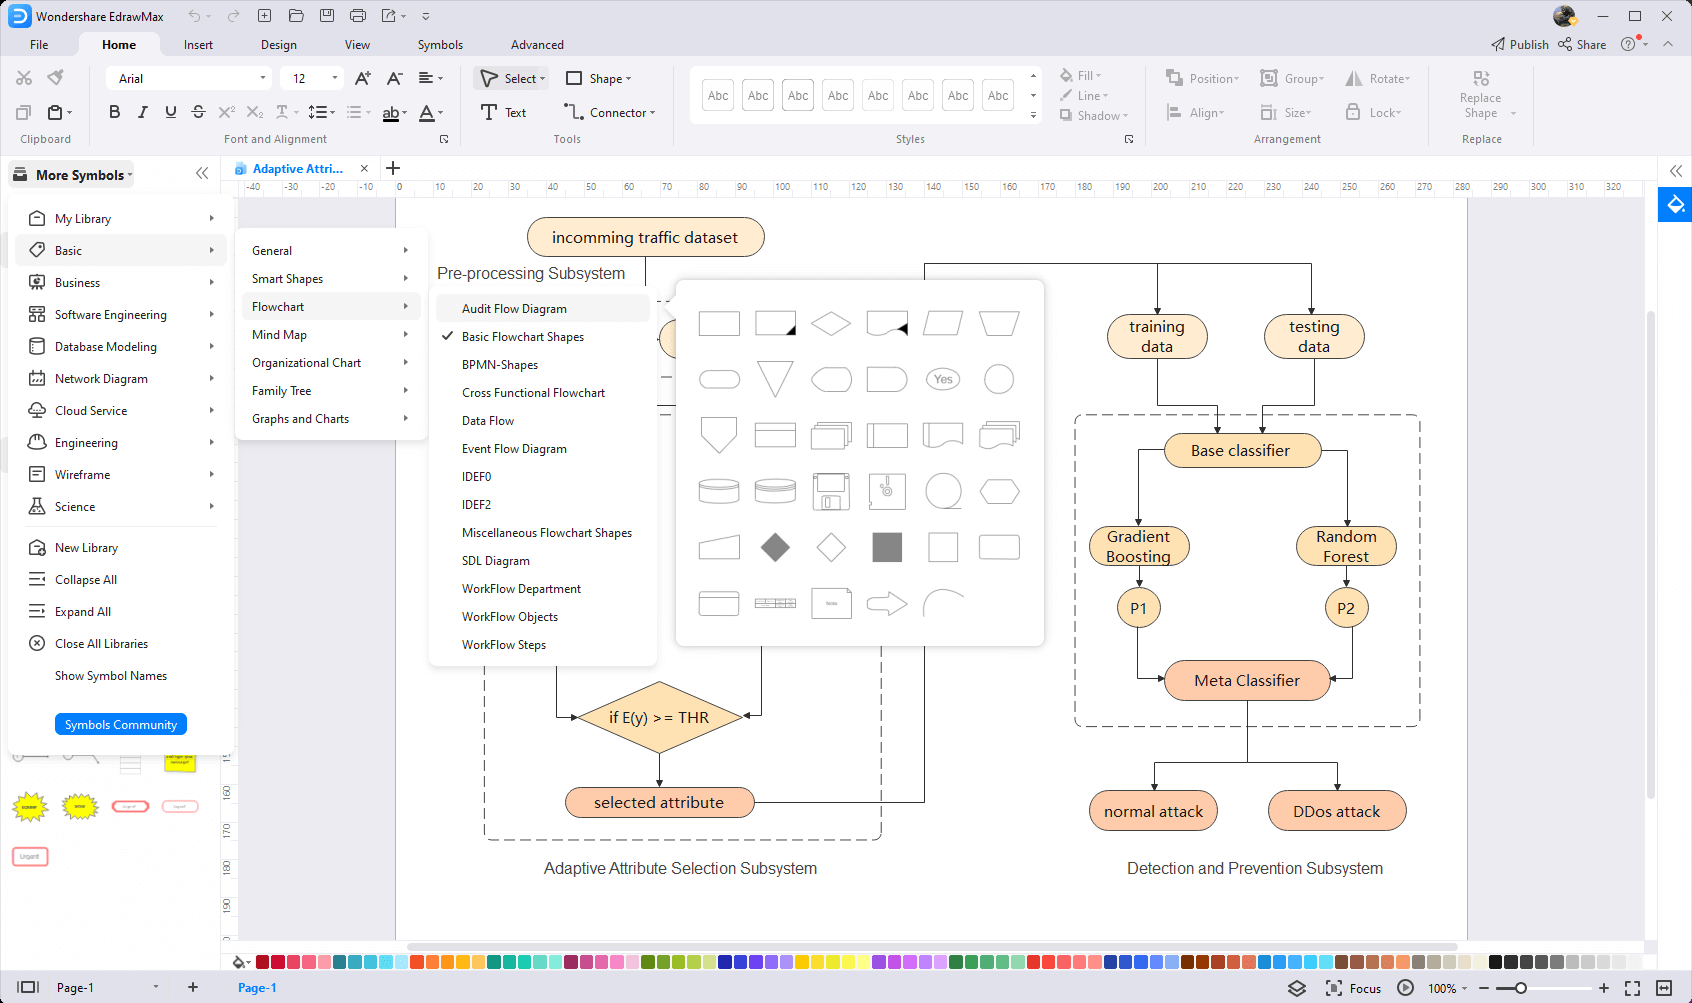
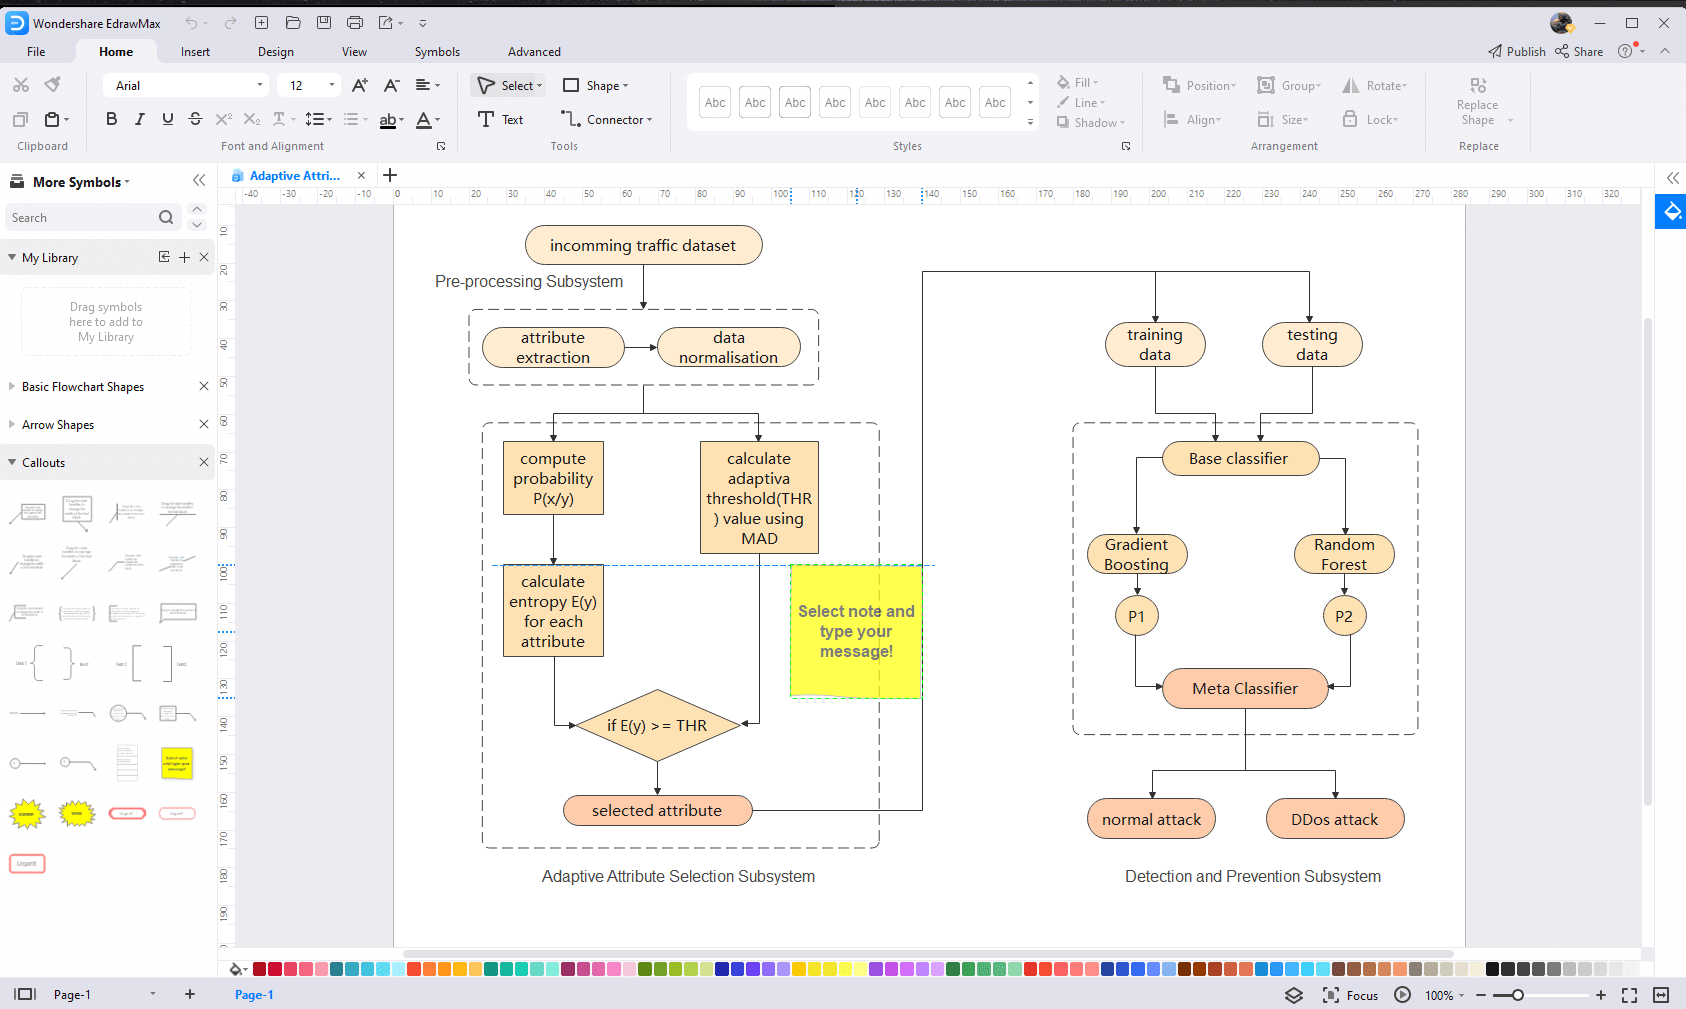
Unlike physical drawing, EdrawMax helps to create a Flowchart easily. In the symbol section of EdrawMax, you will find over 260,000 vector-based symbols that you can use in your designs. In EdrawMax, you can find Flowchart symbols in Symbol Libraries on the left toolbar. You can click on the "+" option to open a new canvas to make your Flowchart. On the left side of the canvas, you will see a symbol library with many flowchart symbols. You can search for specific symbols in the search bar.
Step3 Drag and Drop
Once you find the proper flowchart symbols you want, just drag and drop the symbols to the canvas easily. Keep customizing by choosing the right symbols, proper scale or dimensions, and adding more details, like color, font, and etc. When completed your Flowchart, you can export your file or share your design effortlessly. Learn more Flowchart guide here if necessary.
4.2 How to Create More Flowchart Symbols in EdrawMax
EdrawMax provides you with thousands of symbols to create your diagram. Sometimes you want to use unique or personalized symbols in your diagram that are not in the library. EdrawMax gives you a simple solution to this problem. Follow these steps when you don't find the flowchart symbols you want or you wish to create your symbols to make your diagram.
Step1 Find Symbol Tool
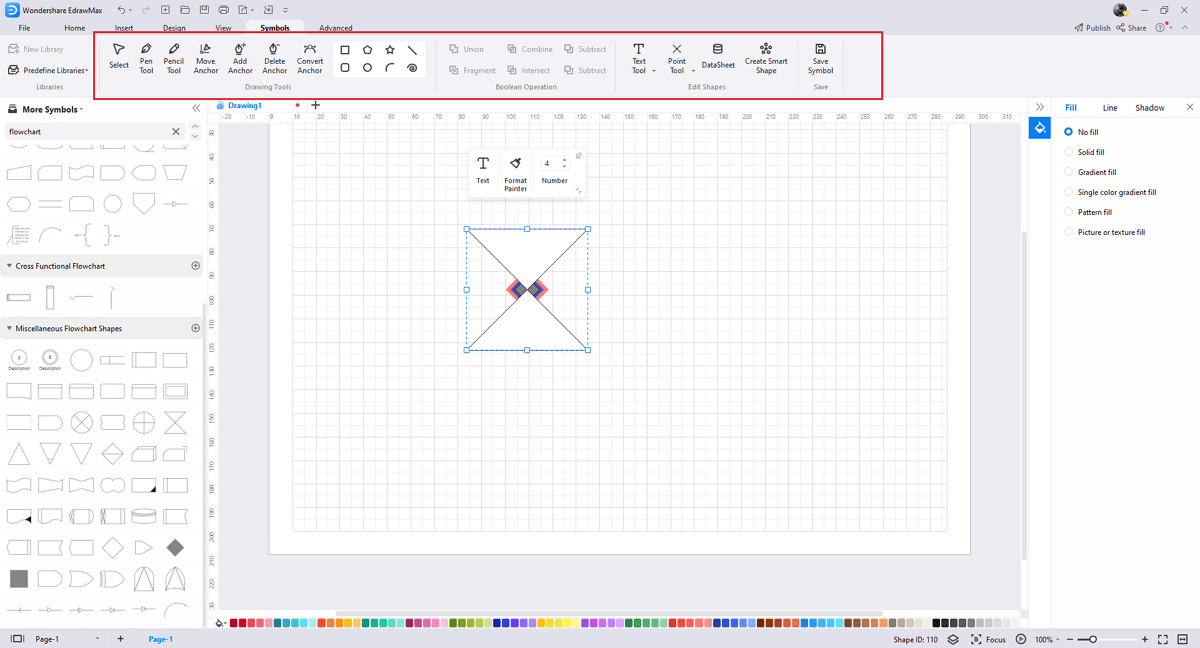
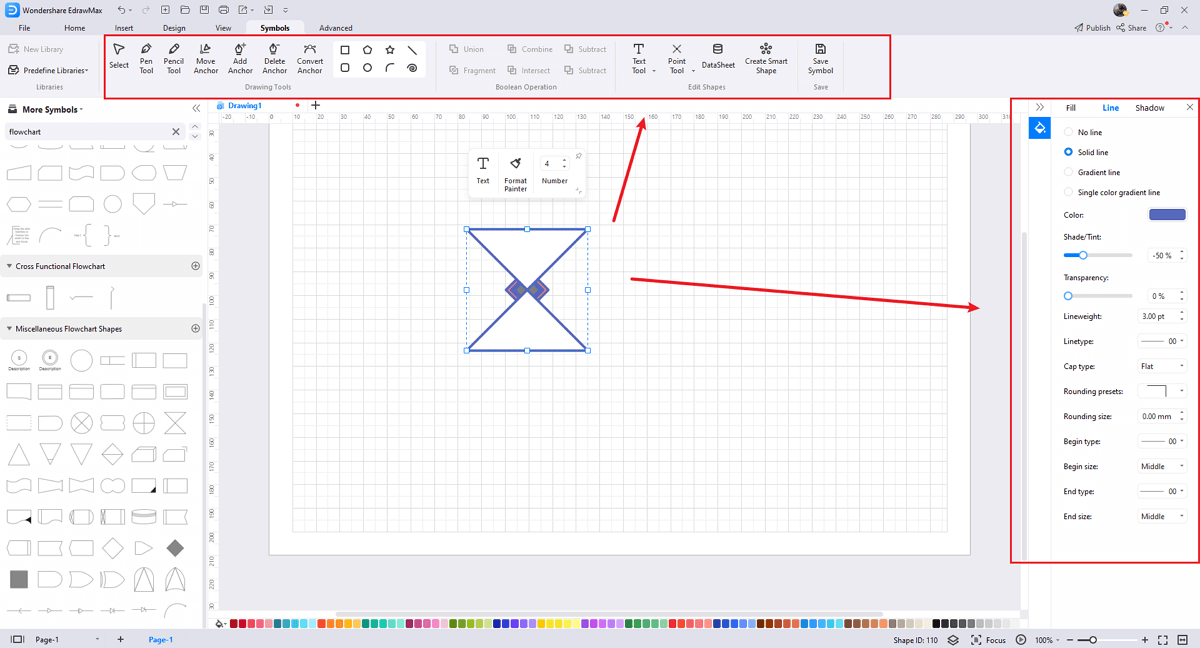
If you can't find any symbol similar to the one you want, you can use the pencil tool, pen tool, and anchor tool to draw your personalized flowchart symbols. It is much easier to draw the symbol you want on EdrawMax instead of searching for the one that suits your requirements. You can also save your symbol in the library for later use.
- Select "Symbols" on the upper Toolbar;
- Use "Pencil Tool", "Pen Tool", "Anchor Tool" to create garden symbol from very beginning;
- Choose "Union", "Combine", "Subtract", "Fragment", "Intersect", "Smart Shape" to make your symbols.
Step2 Create flowchart Symbols
When you create a Flowchart, make sure that the size, design, and other attributes of your icon go along with other flowchart symbols. Follow these steps to draw perfect flowchart symbols.
- Make your flowchart and infrastructure icon square symbol in a circular shape.
- You can use various pen styles to make different parts of your symbol.
- Make sure that the illustration inside the shape does not overlap it.
Step3 Import flowchart Symbols
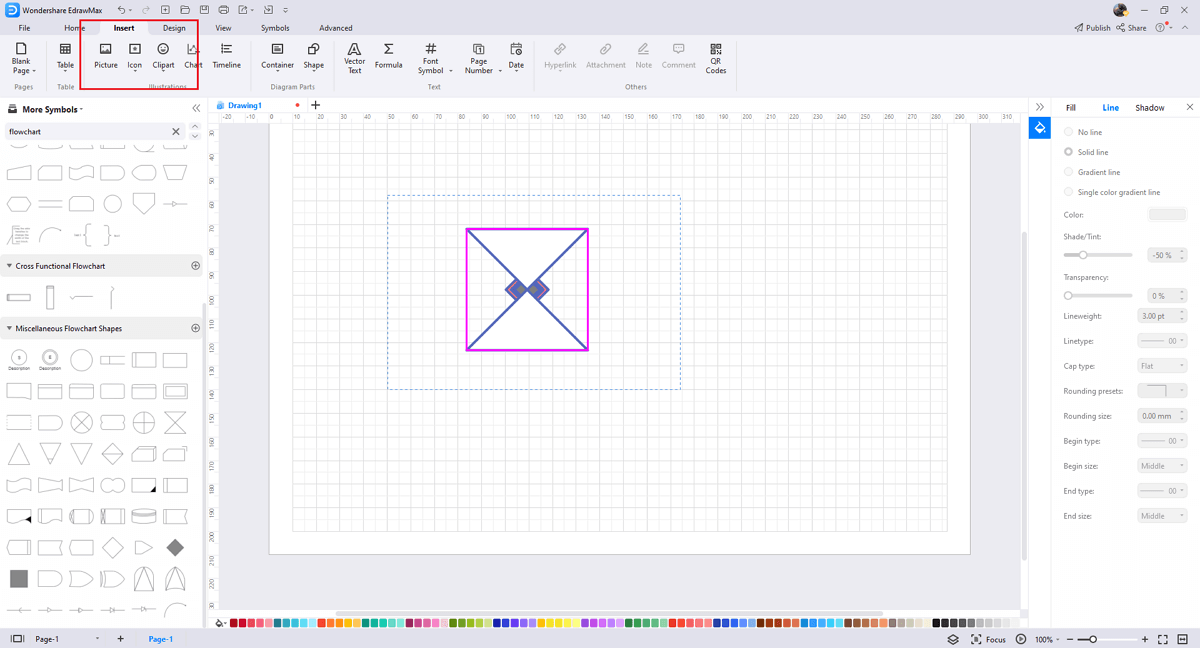
Except for creating new flowchart symbols in EdrawMax, you can import flowchart symbols from your end. Find "Insert" on the top navigate toolbar, and import images to turn into symbols. Or click the thrid option of the right toolbar to insert images faster.
Step4 Save to Your Symbol Libraries
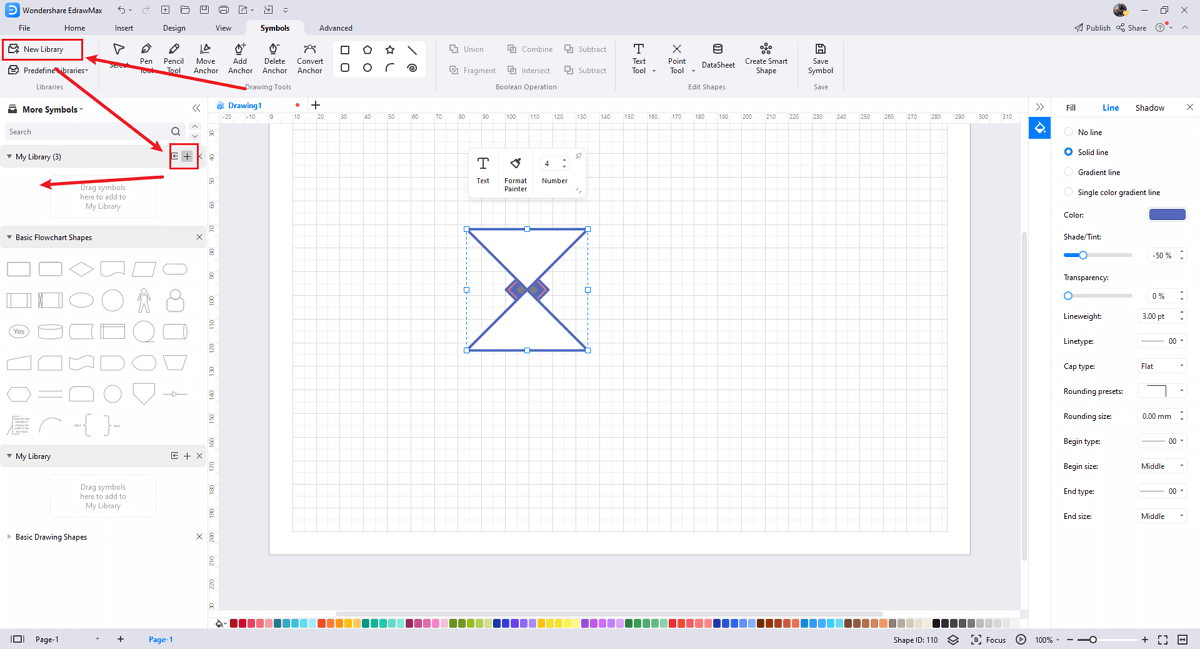
Once you completed your flowchart symbols design or import your symbol images, you should still click "Symbols" on top, and choose "Save Symbol" to your symbol Libraries. Or you can click "+" in My Library on the left toolbar. Learn more about how to draw a Flowchart or design a flowchart from this How to Make a Flowchart (4 Easy Methods) here.
5. Flowchart Examples & Templates
There are lots of templates and flowchart examples to choose from. Using a flowchart template can save a lot of time in composition, and you can refer to the advanced points of other people's diagrams. You can view these pretty flowcharts to consider how to make your own. If you want more, you can get them from Flowchart Examples.
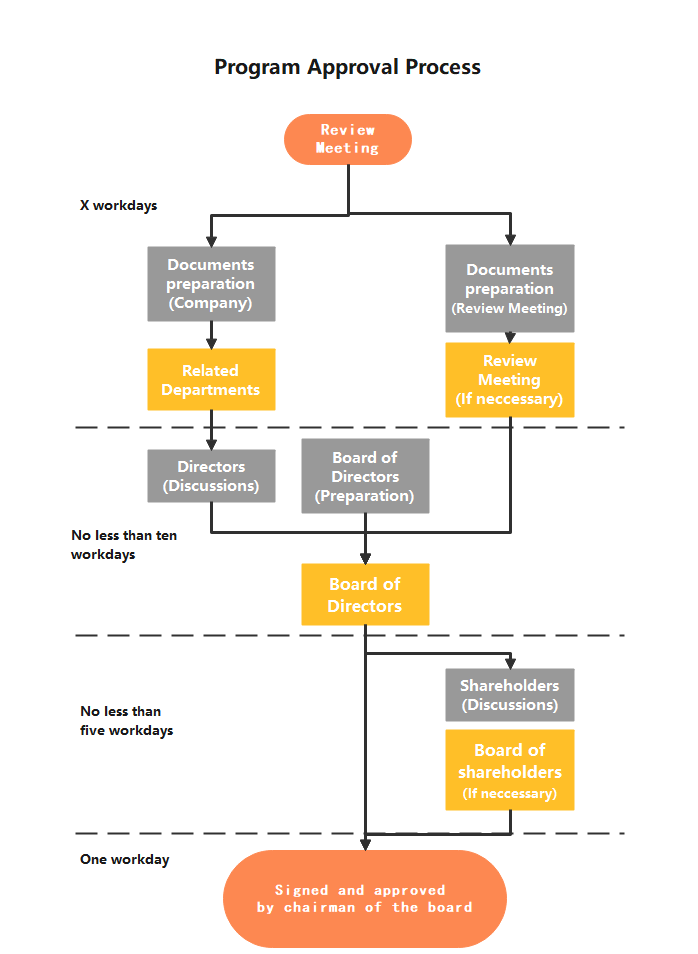
Example 1: Engineering Flowchart
A flowchart depicts the sequential steps of a process as well as the decisions that must be made in order for the process to function.
Example 2: Swimlane Flowchart
A swimlane diagram is a flowchart that depicts who is in charge of what in a process. A swimlane diagram, which employs the pool lane metaphor to improve clarity and accountability, places process steps within the horizontal or vertical "swimlanes" of a specific employee, work group, or department.
6. Flowchart Example & Templates
EdrawMax allows you to create multiple flowcharts at once. For instance, you can open a new diagram while running the previous one. Or you can save several diagrams and return to any of them whenever needed. You may ask why do you need such a sophisticated tool instead of creating flowcharts using some standard software? Simply because with EdrawMax, you will save lots of time and energy when creating diagrams, and the results will be much better.
Key Features of EdrawMax:
- EdrawMax comes with free Flowchart examples & templates that are 100 percent customizable;
- The built-in vector symbols let you easily add Flowchart components to your design;
- You can easily share the Flowchart design with your team and see the live revisions made by your team;
- EdrawMax lets you export the file in multiple formats, including MS Docs, PPTX, JPEG, PNG, PDF, and more;
- EdrawMax has a strong community of 25 million users who update the template community with their creative projects;
- EdrawMax is considered the best tool for beginners and professionals because of the user-friendly dashboard and easy drag-and-drop feature.
7. Final Thoughts
Flowcharts represent cause and effect relationships used in business, management, science, technology, engineering, and mathematics. They are usually based on the idea that if something occurs, then something else will follow. They are commonly used to show how decisions lead to events, which lead to outcomes. Many people struggle with using free software. When it comes to drawing flowcharts, one should understand flowchart symbols first.
Before creating a flowchart , it is better to consider your needs and make a good drawing. Also, specify the access control and develop new flowchart procedures. EdrawMax is the best free flowchart access plan maker that gives you free symbols and templates to make your diagram. Its fast drawing and easy symbol import feature make it the prime choice for professionals.

Flowchart Complete Guide
Check this complete guide to know everything about flowchart, like flowchart types, flowchart symbols, and how to make a flowchart.
You May Also Like
AWS Icons & Symbols
Symbols
Cisco Icons & Symbols
Symbols
Network Diagram Symbols
Symbols
LDAP Icons & Symbols
Symbols
Active Directory Icons & Symbols
Symbols
Google Cloud Icons & Symbols
Symbols


