Matrix Diagram
Part 1: What is Matrix Diagram?
Matrix diagram is a planning and project management tool used to graphically illustrate complex (many-to-many) and analyze relationships between data sets.”
This tool is essential to project managers in that it helps them define how the information relates and the strength of those relationships. With it, a manager can compare elements within one group, two or more groups of elements.
Part 2: What are the Purpose and Benefits of the Matrix Diagram?
Matrix analysis has wider applications, including:
- To compare possible solutions
- To identify and analyze problems’ causes
- To access how well requirements are met
- To recognize improvement opportunities
- To match specifications with the process or project’s requirements
- To help in proper allocations of resources
Well, now you know what its purposes are, let’s now highlight its benefits too.
- It is an effective visualizing tool for the complex relationships
- It is relatively easy to create
- Easily understandable to all parties involved in matrix analysis
- It helps visualize the relationship within an organization between factors, objectives, and causes.
Part 3: Types of Matrix Diagram
Matrix charts are available in five unique types, including:
- L-shaped Matrix
- Y-shaped Matrix
- T-shaped Matrix
- C-shaped Matrix
- X-shaped Matrix
Below we discuss each of them by defining what each type is as well as its use. So, let’s get into it!
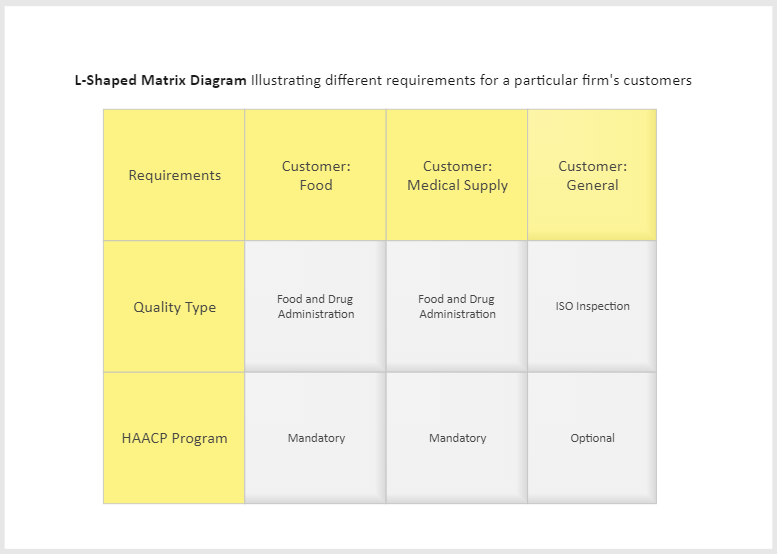
1) L-shaped Matrix
This is one of the most common types of matrix diagrams, and it features a two-dimensional diagram design. This diagram is purposely designed to compare and analyze two data sets’ relationships.
The relationships between two data sets are derived by placing one set on the top row column and the other in the left side column. Their relationships are listed in corresponding cells that both data share.
This is ideal to use when comparing one group of data sets or two groups of items.
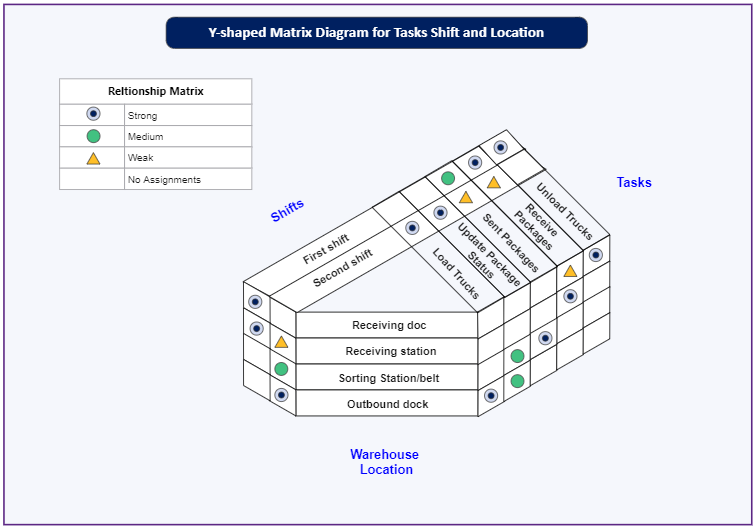
2) Y-Shaped Matrix
The Y-Shaped Matrix diagram is the ideal Matrix analysis chart to use when comparing closely related data sets. This diagram analyzes three groups of items with a circular flow relationship, such as A ← → B← →C← →A.
So, if you need a practically simplified C-shaped matrix to use, you can try this one.
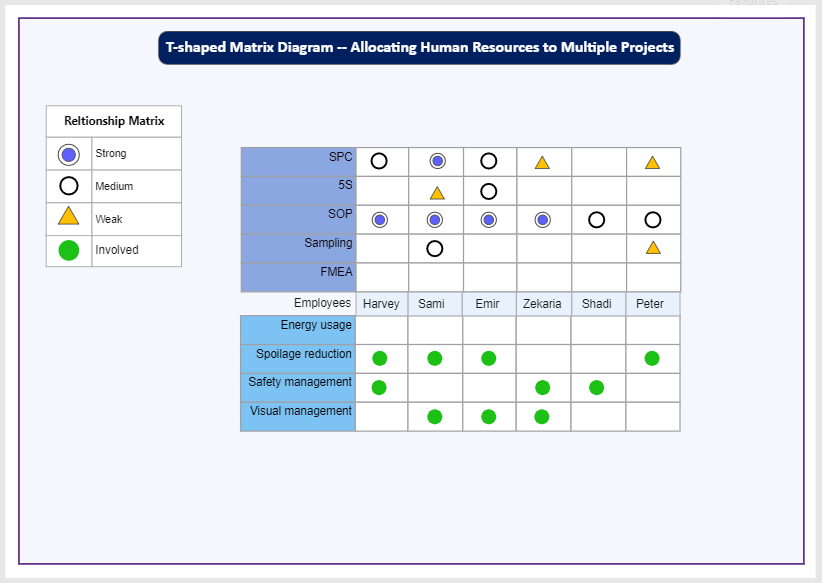
3) T-Shaped Matrix
Ideally, a T-shaped matrix diagram is two L-shaped matrices combined together by a single list. This diagram features three groups of items where one is the core group related to both groups. For example, group A is related to group B and C, but B and C are not linked.
This type of diagram is ideal for comparing three items with two groups being related to one group.
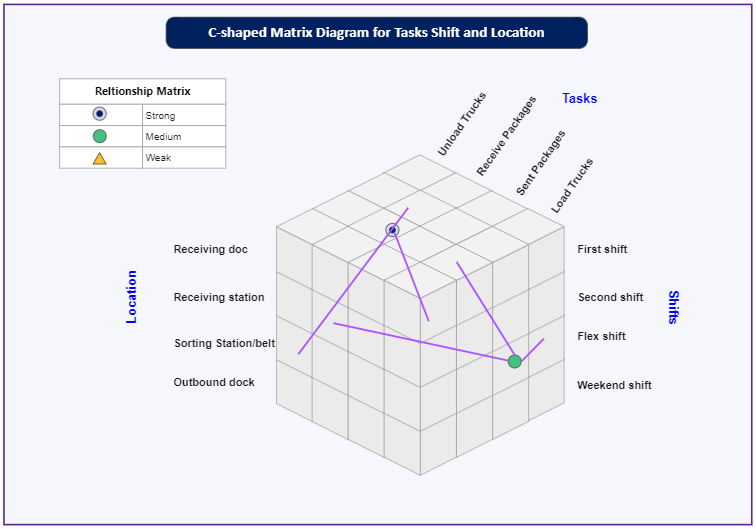
4) C-Shaped Matrix
A C-shaped matrix diagram compares and analyses three items of different lists to define their relationships, which is similar to a Y-Shaped diagram. But unlike a Y-Shaped matrix, a C-shaped matrix is a three-dimensional cube diagram, not a circular flow chart.
This diagram is perfect for comparing three items simultaneously.
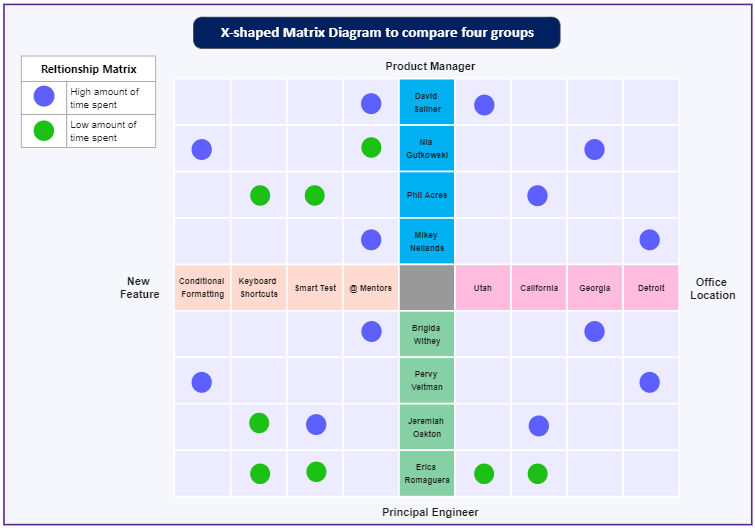
5) X-Shaped Matrix
X-Shaped Matrix is similar to a T-shaped matrix diagram but extended to include an additional set of data. Ideally, this diagram compares and analyzes two pairs of complementary lists, meaning you will have four groups of items.
Part 4: What to do Before Creating Matrix Diagram
Preparation is a valuable process in any project. With it, you can be able to visualize the entire process and well as the outcomes of a project. Therefore, knowing what to do before the actual diagram designing phase is essential. And to help with that, we’ve created a step-by-step guide for you.
Step 1: a well-defined aim or purpose for your matrix analysis chart
Step 2: Determine and collect data to be used in a matrix chart. Ensure your data is accurate and avoid biasness while collecting them.
Step 3: Based on collected data, select the appropriate matrix type to use. Remember, an ideal type matrix chart will depend on the objectives and type of the data sets. Ideally, It will be great to take a pen and paper and create a draft diagram to see how it looks.
Note: Steps 1-3 are steps that you will only do before creating a matrix diagram. But steps 4-6 are the ones that will be done while you have created a matrix diagram. However, you can also do this on your draft copy using a pen and paper, and then if you see everything is okay, you can now head over to the designing process.
Step 4: What structure will you use to compare data? Well, for this, you will have to determine the appropriate symbols to use.
Step 5: Do data analysis to determine your data sets’ relationship dependencies. So, you will have to compare them by going through each cell.
Step 6: Do a review of your analysis and then draw a conclusion.
Part 5: How to Create Matrix Diagram in EdrawMax
Below are 5 simple steps on how to create a matrix diagram using EdrawMax.
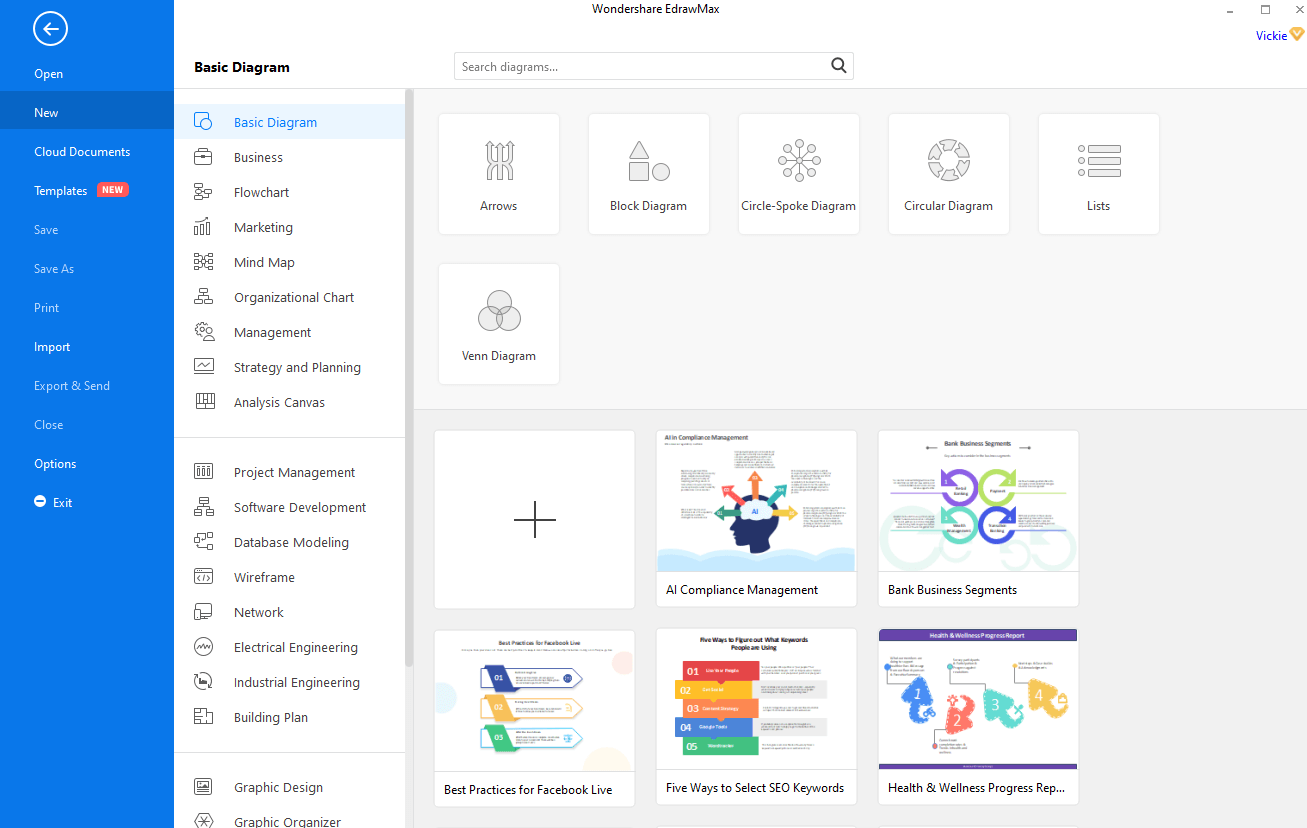
Step 1: Sign in EdrawMax
Open EdrawMax software or EdrawMax web-based application and sign in. If you have no account, you can quickly create one.
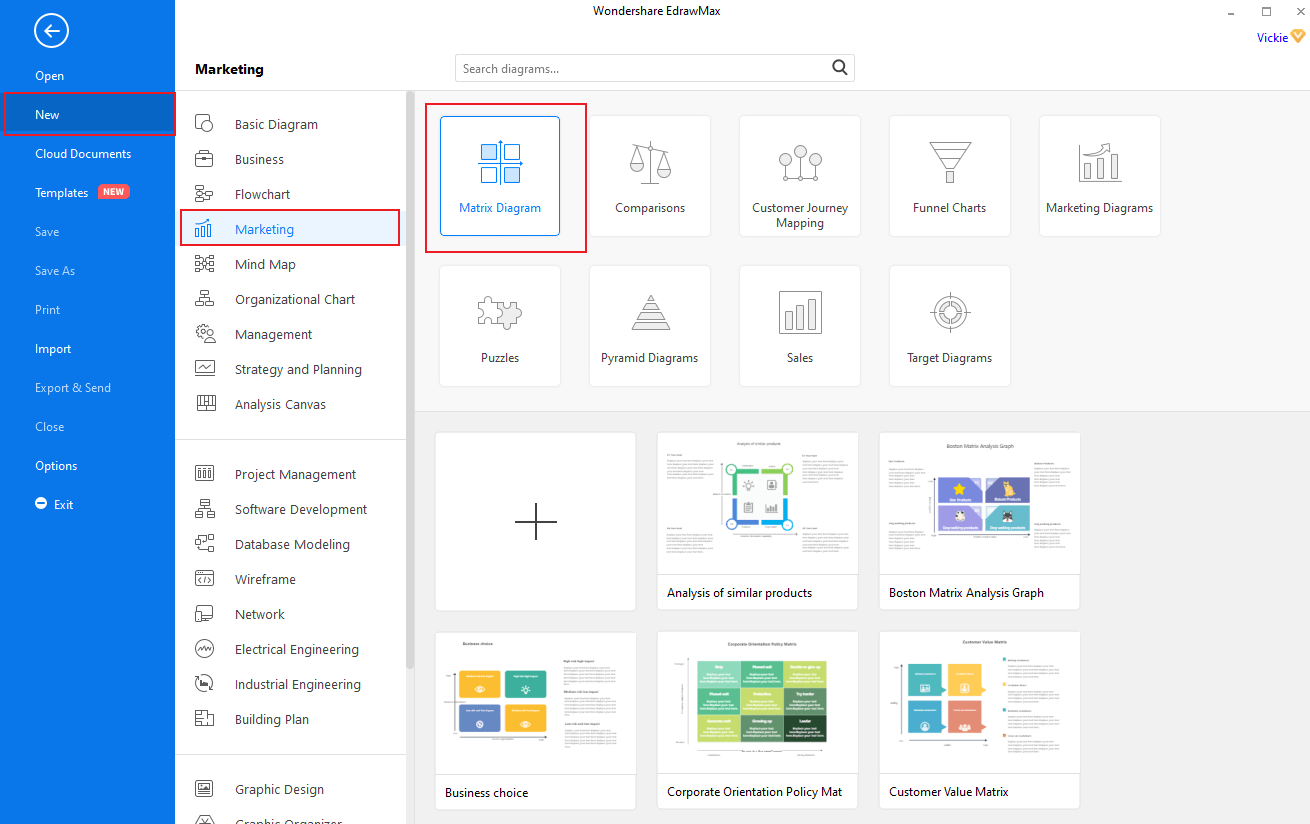
Step 2: Select matrix diagram
Well, after you’ve signed in, click on [New] in the left blue navigation panel, then select [Marketing] > [Matrix Diagram] and let it load.
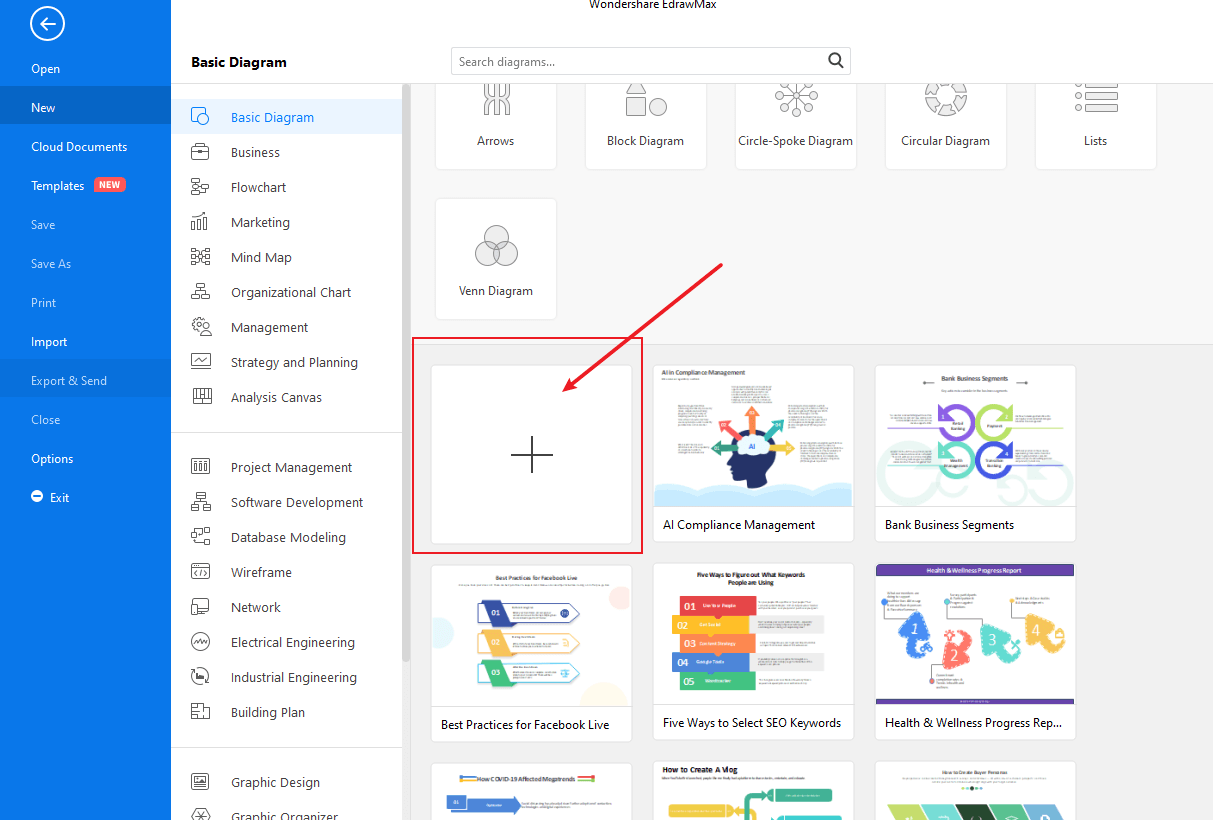
Step 3: Choose a template or start from scratch
On this page, you will see several templates that you can choose from. So, browse through them and select the one you like by simply clicking on it. But if you fail to find the ideal one or you want to create a whole new diagram, click [+] to open a new blank page.
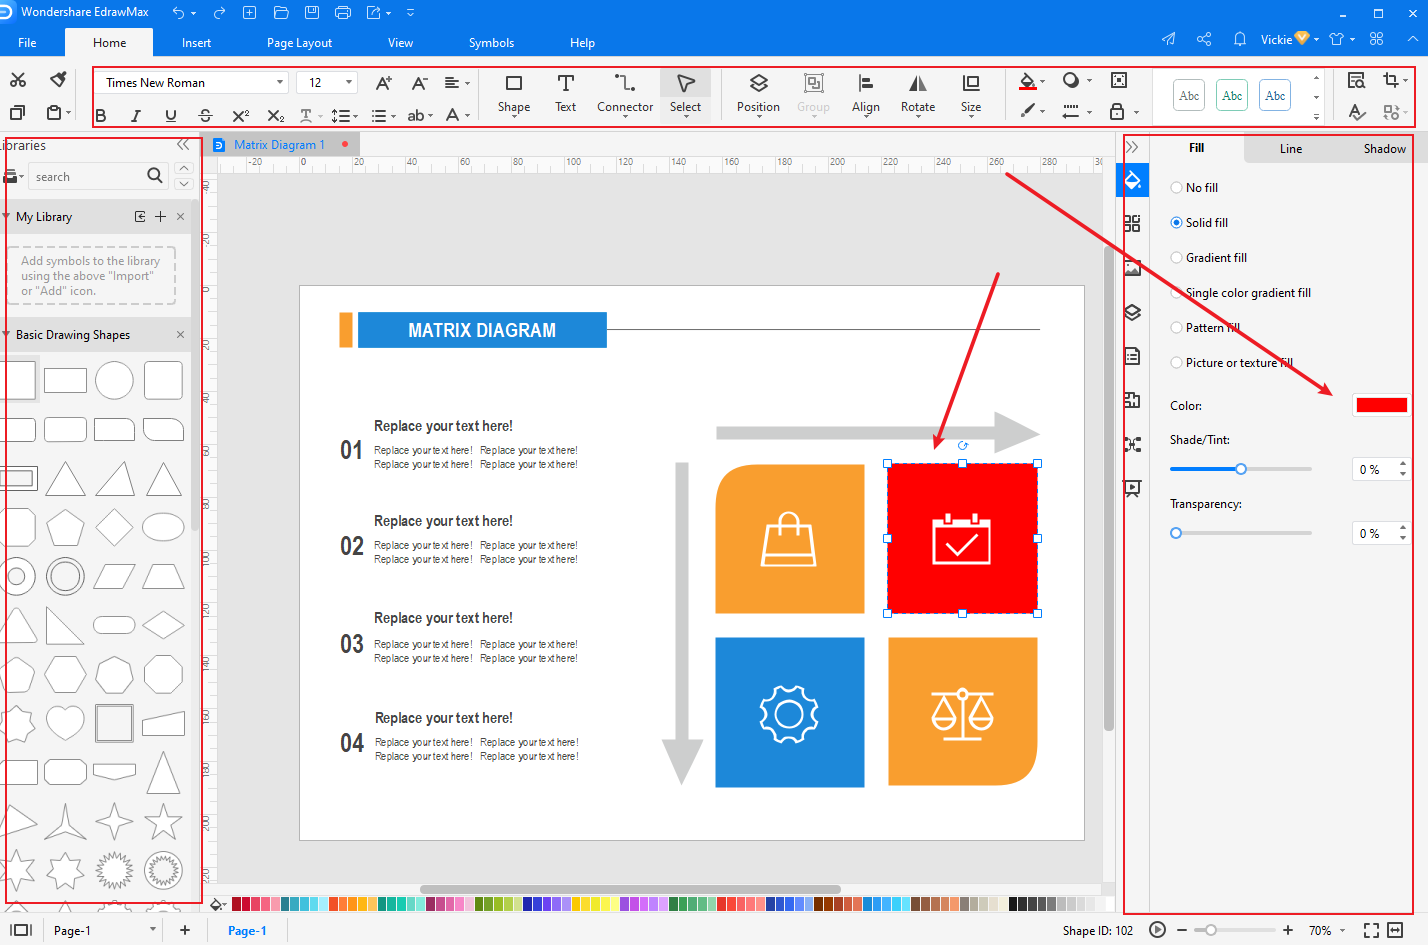
Step 4: Editing and Designing process
In this step, you can edit the template you choose using this EdrawMax’s designing tools. This tool is also fitted with all symbols necessary to create a Matrix diagram from scratch. So, check on the symbols library to select, drag and drop all symbols to the blank page to create your diagram.
This tool also allows you to customize a diagram or symbols to fit your requirements. For example, you can edit the color, size, shape, text, and even position of your symbols.
In this phase also you will be expected to fill your diagram with contents.
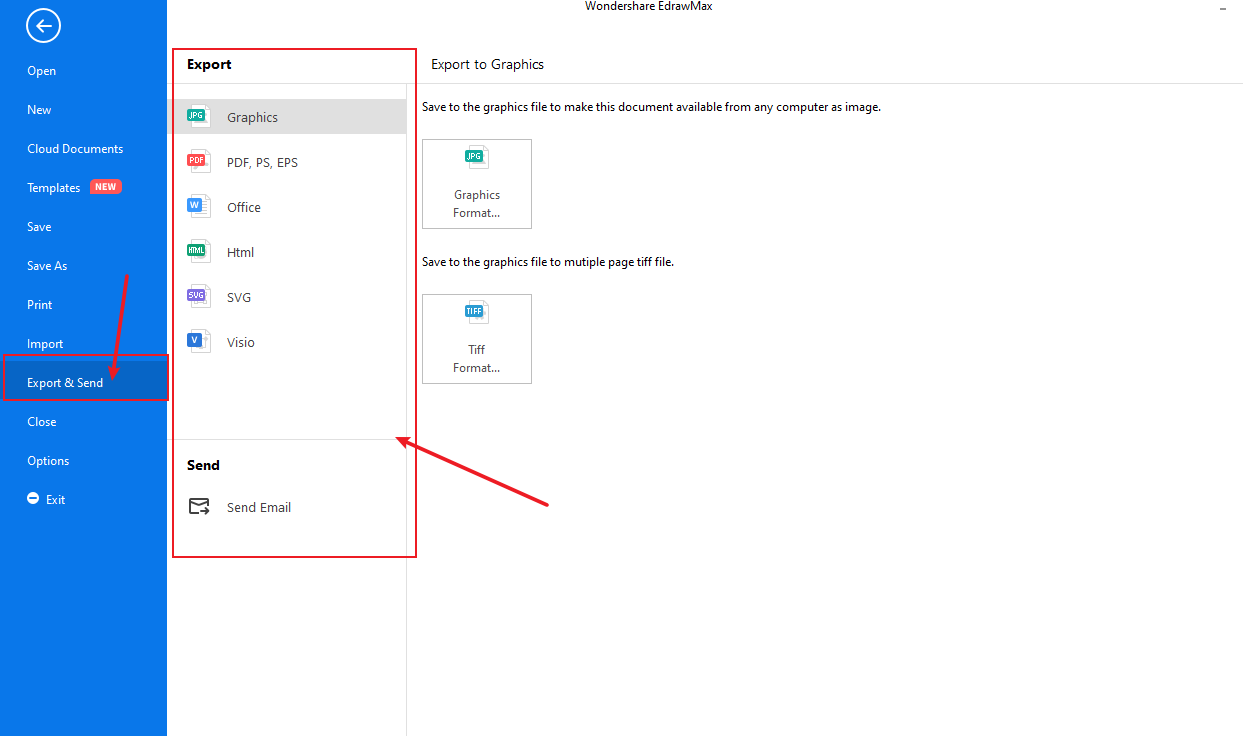
Step 5: Save, Export, and Share
With EdrawMax, you can save, export, and even share your work with colleagues or friends via mail or social media platforms. To do this click [File] > [Save/Save as] or [Export].

An all-in-one platform for 210+ diagrams.
・ Simple alternative to Visio
・ 26k+ symbols
・ 10K+ free templates
・ 10+ AI diagram generators


Part 6: Examples of Matrix Diagram
Basic Matrix Diagram
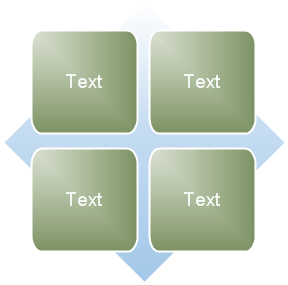
It is used to show the relationship of components to a whole in quadrants. The first four lines of Level 1 text appear in the quadrants. Unused text does not show, but remains available if you switch layouts.
Grid Matrix Diagram
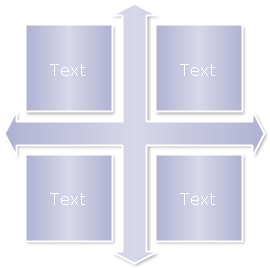
This is used to show the placement of concepts along two axes. It emphasizes the individual components rather than the whole. The first four lines of Level 1 text appear in the quadrants. Unused text does not appear, but remains available if you switch layouts.
Titled Matrix Diagram
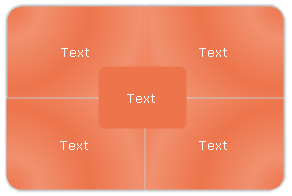
People use it to illustrate the relationships of four quadrants to a whole. The first line of Level 1 text corresponds to the central shape, and the first four lines of Level 2 text appear in the quadrants. Unused text does not appear, but remains available if you switch layouts.
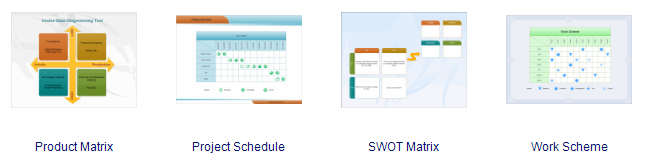
More Matrix Diagram Examples
More articles


