How to Draw a Network Diagram
Edraw Content Team
Do You Want to Design Your Network Diagram?
EdrawMax specializes in diagramming and visualizing. Learn from this article to know everything about how to design your network diagram with ease. Just try it free now!
A network diagram visual represents all the different entities in a group. Creating a network diagram for your audience will help them understand the relationship between all the parties involved. You may not know how the relationship between the different players works, but a network diagram can help everyone involved better understand each other.
Imagine if you could harness the power of a network diagram to accomplish anything even things you thought were impossible effortlessly. In today's fast-paced world, the ability to create a functional and practical network diagram can be invaluable. Whether you are looking to manage your network, develop a new business strategy, or communicate ideas to others, you will love this super easy tool that draws network diagrams professionally. In this article, you'll learn how to draw a network diagram and use it to show who you know, what you know, and who's responsible for what in your organization.
1. What Is Included in a Network Diagram
A network diagram is compelling. We use them to visualize how different parts work together, what goes where, and how different nodes and links are connected. But a network diagram is only effective when it is complete. It's the missing parts that make a network diagram so powerful. Let's explore some of the most critical parts of a network diagram and how they can be used to increase its value:
- Nodes:
- Edges:
- Attribute:
- Lines:
- Circles:
- Node Size:
They represent individuals or other entities. Nodes can either be people, products, or services and represent relationships between each other in a network diagram. Network diagrams can help identify the relationship between nodes in an organization and the connections that may exist.
In a network diagram, edges represent relationships between people, products, or organizations. Edges can be either directed or undirected. Directed edges show relationships in a flow of information, while undirected edges show relationships but aren't necessarily used for communication.
An attribute is a characteristic of the object. It describes a node or an edge. The attributes you put in your network diagram should be based on your unique goals. The more specific you are, the better. A common mistake is to include too many attributes in a network diagram. Instead, only include attributes you expect to see in the final project.
Represents the flow of data from your customer to your business. The first line in a network diagram, the solid line, is the Mainline. A Mainline represents the primary direction of the flow of a system, whereas a subsidiary line represents the secondary direction of flow.
Circles on a network diagram are used to show groups of related data. They provide a quick and visual overview of the relationships between nodes. They are used frequently in network diagrams to give a visual overview of groupings and relationships.
The node's size doesn't indicate anything about the quality of the connection, but it does show the level of importance. The bigger the circle, the more the user connects with that particular item, and the more critical it is to them.
- Nodes;
- Edges;
- Attribute;
- Lines;
- Circles;
- Node Size;
2. Preparations for Drawing a Network Diagram
It's easy to get lost in the details when drawing a network diagram. The best way to avoid this problem is by preparing a plan of attack before beginning the actual drawing. A good plan of attack will help you:
- Gather Relevant Data
- Decide What Kind of Diagram You Want to Create
- Organize the Data into Categories and Subcategories
- Map out How Information Flows
- Avoid a "Busy" Look
To understand the network diagram, you'll need to gather relevant data. You'll need to find out what kind of network you're describing (e.g., supply chain) and who needs to see it (e.g., management). The most important thing to remember is that the data needs to be collected in chronological order. Data should be gathered at the project's start, midpoint, and end.
If you are creating a diagram for an internal communication tool, there is no need to include as many details as you would if you were making a sales or marketing tool. Knowing the types of diagrams you can use to make your point is half the battle for your readers. The other reason is that it can help you remember how to draw the network after a while.
Once you've collected your data, you'll likely need to organize it. This process is called categorizing or organizing the data. This is when you'll break your data down into groups that are easy to understand, understand in detail, or understand. You'll use this process to structure your network diagram.
A network diagram maps out how information moves through the organization and what resources and people are needed for various company parts. A network diagram shows information flow within an organization at its most basic. Think of a map, a flowchart, or a Venn diagram. These tools can help you visualize how information moves throughout your company.
When you're trying to make a network diagram, you'll likely want to avoid anything too busy. You want to draw the viewer's attention toward the topic at hand. The busy look comes from drawing too many lines and arrows, making it harder for readers to digest the information contained within. It's also good to ensure that the diagram clearly shows the hierarchy or the relationships between the concepts being represented.
3. How to Draw a Network Diagram in General
A diagram aims to help the reader understand a complex system by visualizing it. However, drawing a diagram from scratch can be difficult, as it involves many steps. To help, I've outlined the old-aged process to create a simple network diagram below.
- Sketch a network diagram with shapes:
- Show the flow of information:
- Choose a technique:
This technique is beneficial if you are working on a project with many steps. There's no need to fill the diagram with colors or make any other decoration; place a label next to each node in the diagram. Helping to remember the names and relationships between nodes helps keep everything straight.
Network diagrams are handy in explaining how ideas and information are passed on between people, groups, and organizations. Use a flowchart to illustrate the information flow. Understanding how to design a flow chart helps you see the flow of information, the Flow of decisions, the Flow of thought, and the Flow of emotions.
With all the different ways to communicate visually, many people wonder whether they should choose one visual communication method over another. There is no single technique that is the best. Instead, what matters is choosing a technique that is right for you.
Overview of the Standard Method of Drawing Network Diagrams:
- Sketch a network diagram with shapes;
- Add labels to the nodes;
- Show the flow of information;
- Choose a technique;
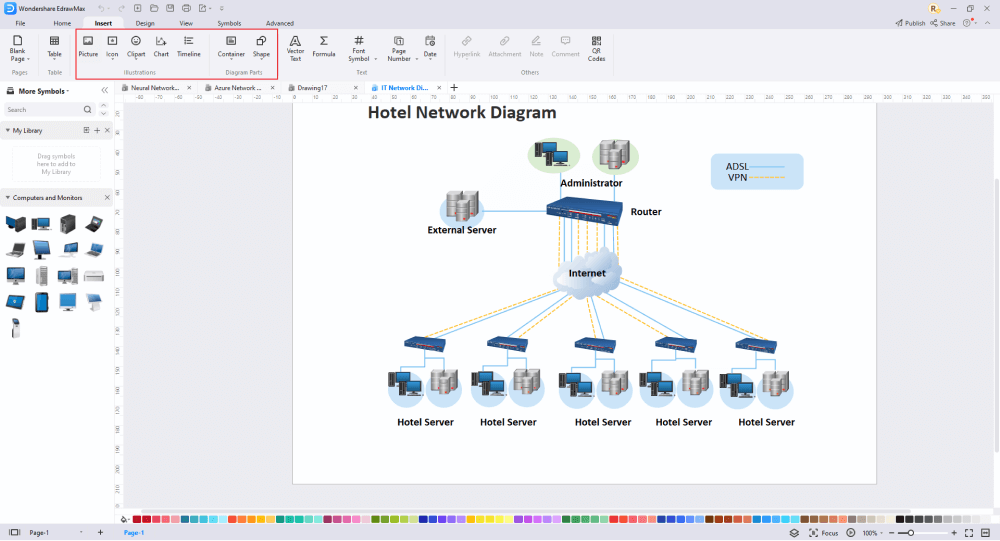
4. How to Draw a Network Diagram in EdrawMax
Having decided that you need a network diagram for your project activities, you must be wondering how to create one? There are two ways that you can do it. There are two methods. One is drawing a network diagram layout from scratch using EdrawMax, and the other method is when you choose a template provided by EdrawMax. If you want to design a network layout, you must consider what kind of network you are trying to build. Let's walk you through the steps:
4.1 Draw Network Diagrams from Scratch
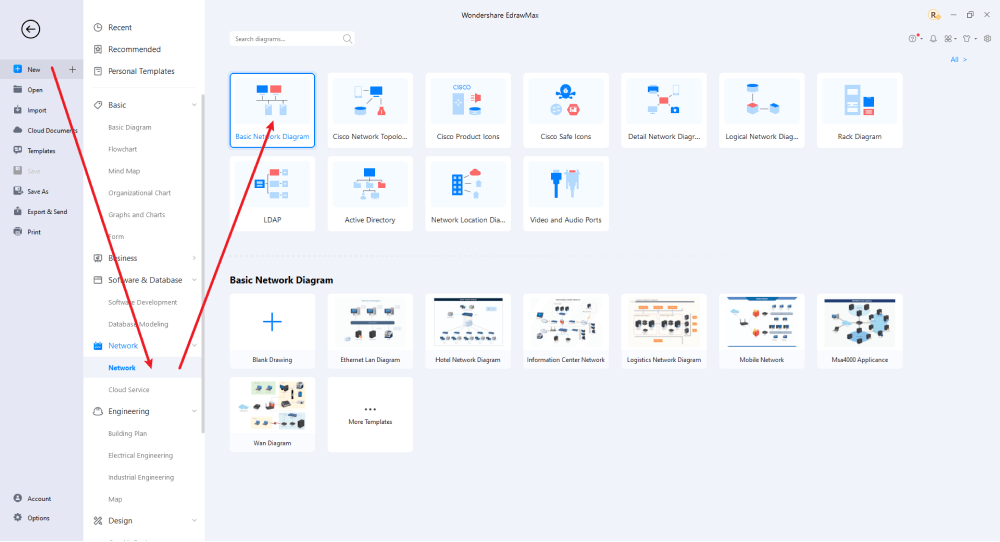
Step1 Open EdrawMax & Login
If you are using the offline version of EdrawMax, then open the tool in your system. If you wish to have remote collaboration, head to EdrawMax Download and log in using your registered email address. If this is your first time using the tool, you can register yourself using your personal or professional email address. Go to 'Network' and click on 'Basic Network Diagram'.
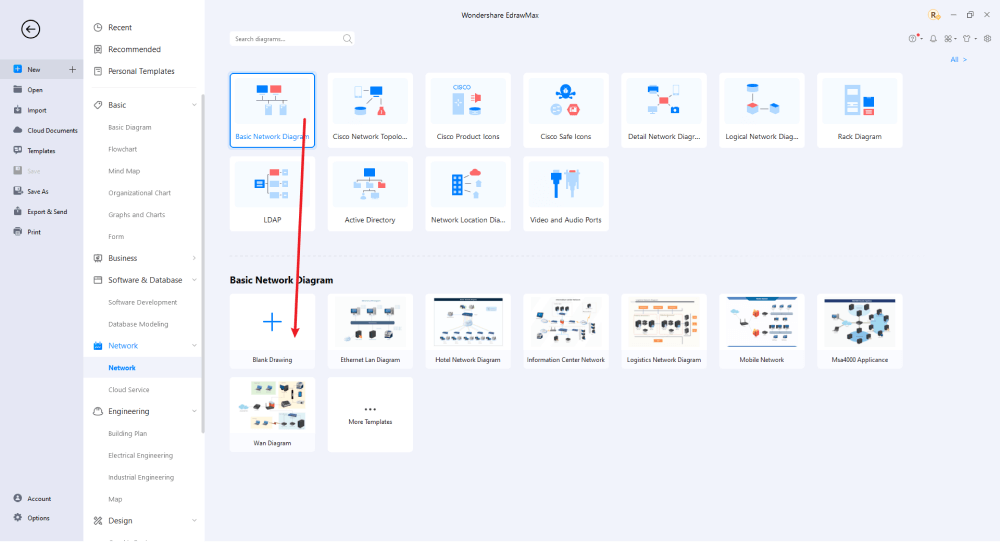
Step2 Open a New Canvas
When you're building your network diagram from scratch, just hit the + button on the left, and it will take you to the EdrawMax user-friendly canvas, where you'll find features like importing images, adding text, drawing shapes, and changing shapes, and more. Create the basic sketch and then add shapes (nodes).
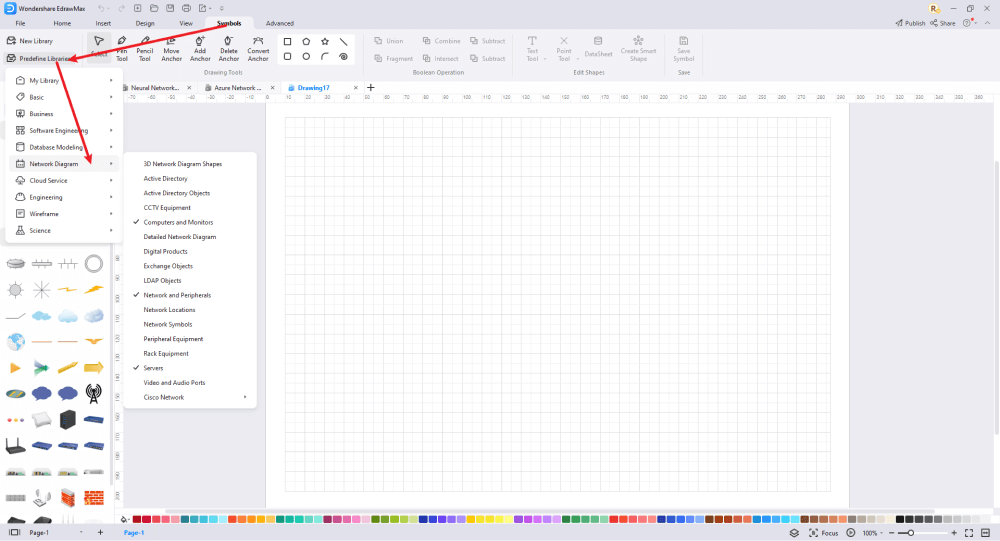
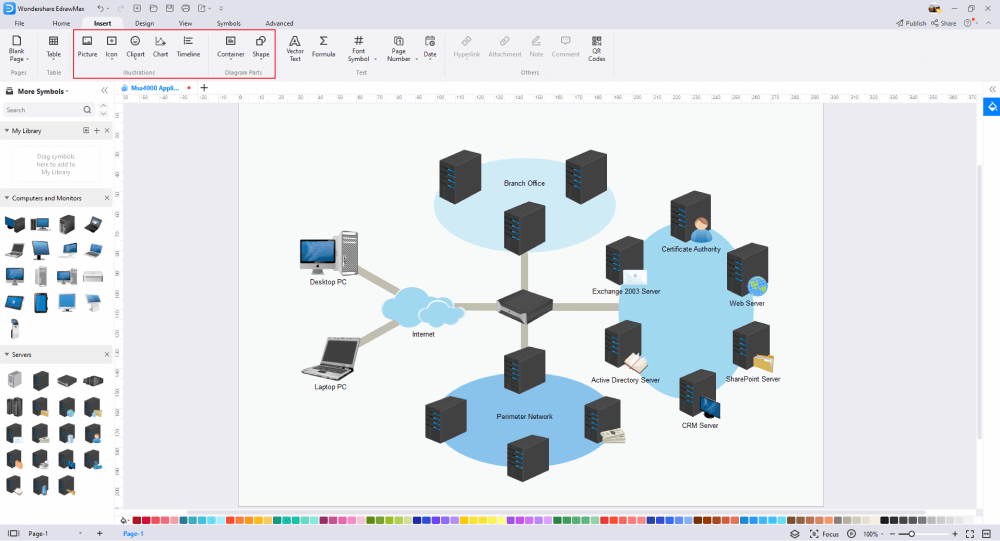
Step3 Select Symbols
Create the basic outline of your network diagram. Go to Symbols Tab and click on Predefine Libraries > Network Diagram to get more symbols. The Network Diagram window is your best friend! It will show you a lot of pre-built and valuable icons, such as digital products, network symbols, etc. Use the symbol of your choice and import them to your library.
Step4 Add Elements
Once you have imported all the symbols, you can start placing them in the network drawing created in Step #2. When planning the landscaping design, you'll also need to add other landscaping items from the element section. Use the toolbar on the right to change the font, color, theme, size, and more.
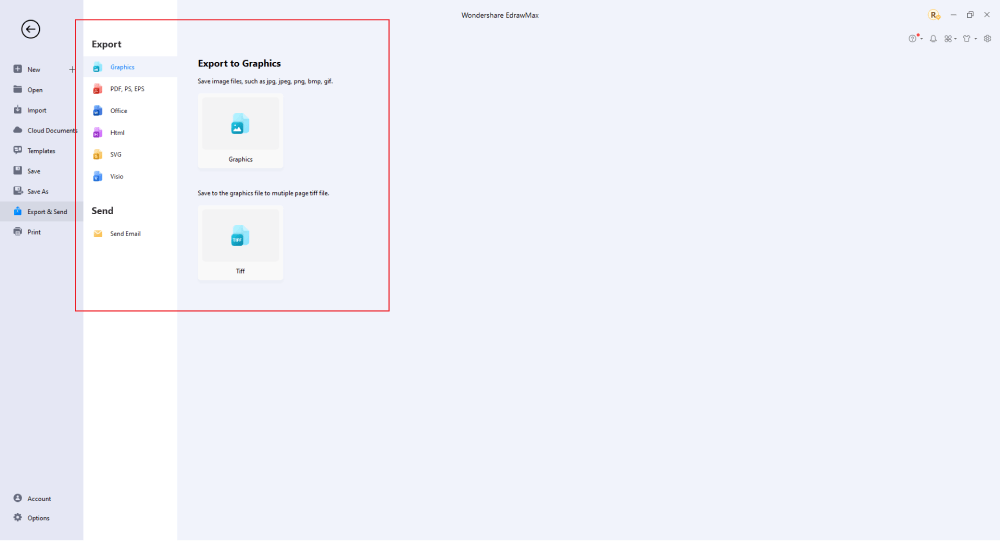
Step5 Save & Export
After designing the network Diagram, you can export it into multiple formats, like JPEG, JPG, PNG, PDF, and other Microsoft formats, like MS Word, MS Excel, PPTX, etc. You can also share the network layout design on different social media platforms, like Facebook, Twitter, LinkedIn, etc.
4.2 Draw a Network Diagram from Built-in Templates
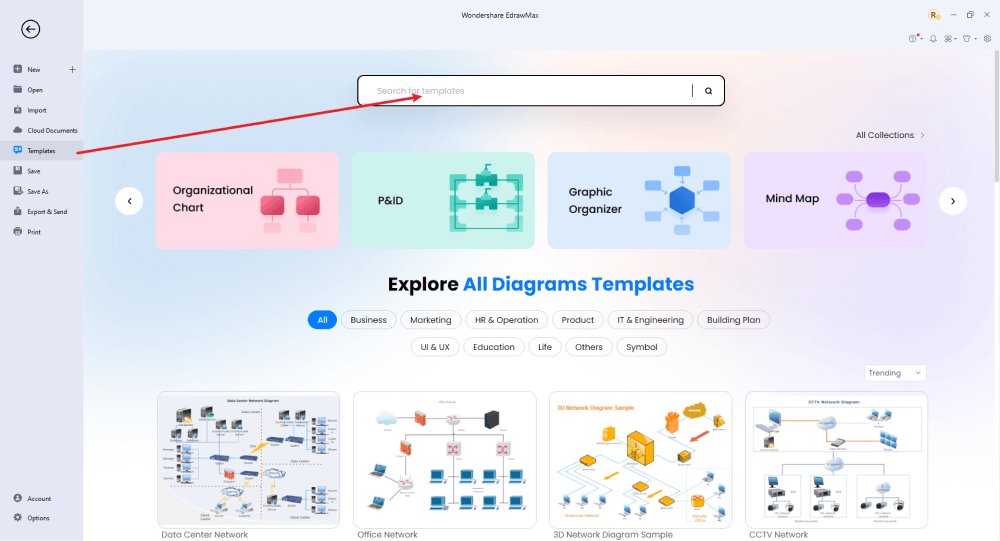
Step1 Login to EdrawMax
If you are using the offline version of EdrawMax, then open the tool in your system. If you wish to have remote collaboration, head to EdrawMax Download and log in using your registered email address. If this is your first time using the tool, you can register yourself using your personal or professional email address. Go to the 'Templates' section on the left and type 'Network Diagram.'
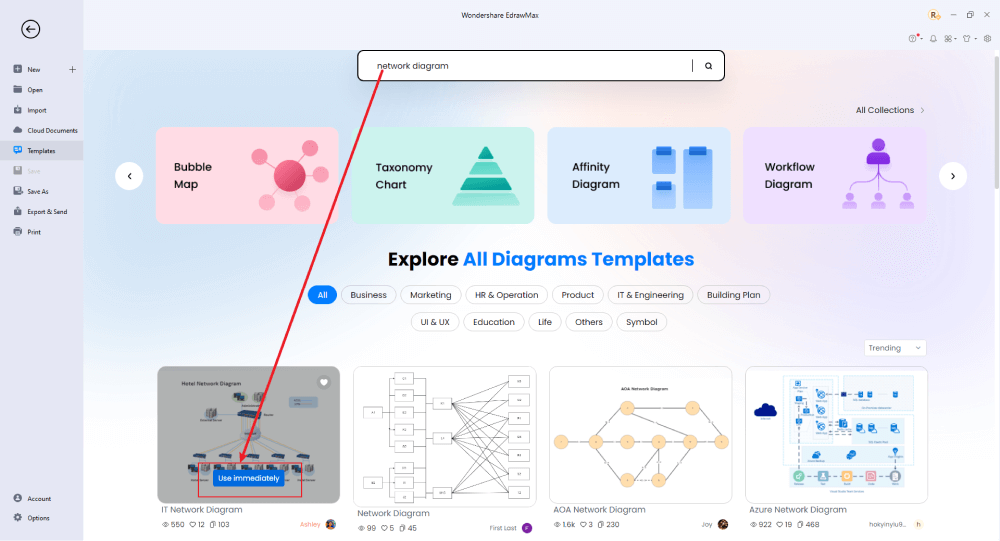
Step2 Choose a Template
In the template community, you will find hundreds of built-in templates readily available to use. Choose any templates that closely resemble your ideal network diagram and duplicate it to 'Use Immediately.'
Step3 Change Details
In addition to importing the template to the EdrawMax canvas, you can change some details as required. You can use images, create your layouts, choose your colors, and add extra features. You can use these server symbols in your network drawing based on your vision.
Step4 Export or Publish
Once your network diagram is complete, you can save it to multiple file formats as described in the instructions or post it to the template community for the other 25 million registered users to see and get inspired by your neural network drawing. Click the "Publish" button on the top right area of the canvas, and fill in your template details, like template title, description, and tag to share your drawing with others.
Basically, it is simple to draw a network diagram in EdrawMax, just grab a template and keep customizing, drag and drop professinal network diagram symbols to make your drawings better. If you are still confusing about how to draw a network diagram in EdrawMax, just check the video below, or learn more from our Youtube channel.
5. Tips & Considerations
A well-crafted network diagram helps you materialize your design ideas. It's easy to see that you can make the most of this area with a network plan. You can write your network plan based on your experience, or if you're not familiar with the topic, you can create the network plan using free templates or from scratch.EdrawMax is full of powerful symbols and icons to help you draw professional-looking designs. So, even if you are a newbie, you'll find all the networking elements right there on the dashboard. It's never a bad thing to get inspired by all the hundreds of free network templates you have at your disposal as you start to design one for your project.
Advantages of Creating a New Network Plan from Scratch:
- All your network designs will be unique and easy to understand.
- You'll learn what the best elements are and what elements to avoid.
- If you're familiar with the design from scratch, it should be easy to revise your design.
Advantages of Using Free Templates:
- Anyone can easily create network plans.
- It will take you over five minutes to get customized the free built-in templates.
- An extensive collection of templates offers an array of ideas for network diagrams.
5.1 Symbol Libraries
EdrawMax is equipped with tools that help you design, modify, and organize your drawings. In the library section of EdrawMax, look for the network symbols, like 3D Network Diagram Shapes, CCTV Equipment, Digital Products, Server, and more. If you click on them, they will be imported into the dashboard.
5.2 Template Community
Over a quarter-million people in more than 180 countries are actively using EdrawMax, which has a rich template community that that gives users a quick start. ou'll never have a template run out from network plans to Cisco layouts with the powerful yet easy-to-use EdrawMax. Many beginner and professional designers rely on the online resources available in these template communities to make their efforts easy. These network diagram templates allow users to view and share designs easily.
6. Free Network Diagram Software
Traditional design software can help create many types of designs and layouts. But in some cases, they aren't the best solution for specific projects. For example, if you need to create something specific and detailed, like a detailed timeline, or if you need to create something unique or creative outside the standard toolset, you should consider using the best program for the job. EdrawMax, as the free network diagram software, is powerful and robust, with plenty of features and benefits:
- EdrawMax lets you export files in multiple formats, including MS Word Documents, PowerPoint presentations, JPGs, PNGs.
- It's easy to share the live view of the design with your team members and see the live changes made to the design by your team.
- You get a free Edraw Max network plan example & template, which is entirely customizable.
- You can easily add network components to your design with the built-in vector symbols.
- EdrawMax's community of 25 million users creates new designs for their business and shares these designs with the template community.
- EdrawMax is the best for all beginners and professionals. It's easy to use, and its user-friendly interface is perfect for anyone.
7. Final Thoughts
There is a tremendous amount of competition in the field of diagramming tools. If you lack those, you can still create a network diagram using EdrawMax with free pre-build templates. On the other hand, if you are a professional who has to make network diagrams regularly, EdrawMax can serve you with its advanced tools. Moreover, Edraw's intuitive UI and multiple features will make the process quicker and easier.
After going through this guide, you will be sure that EdrawMax is all you need for your diagramming needs. The best tool that will ensure not only perfect work but also fast work. It is a great diagramming tool to draw professional-looking and presentation-quality network diagrams and other technical drawings!

Network Diagram Complete Guide
Check this complete guide to know everything about network diagram, like network diagram types, network diagram symbols, and how to make a network diagram.
You May Also Like
How to Draw a Rack Diagram
How-Tos
How to Make a Floor Plan in Word
How-Tos
How to Make a Floor Plan in PDF
How-Tos


