How to Create a Process Flow Diagram?
Contents
What is Process Flow Diagram?
A Process Flow Diagram(PFD) is a schematic illustration commonly used in chemical and process engineering to show the general flow of processes and equipment in a plant. It shows only the major equipment and doesn't show minor details.
Industrial plants in the chemical and process engineering fields have a multitude of major working parts and components. Process flow charts are used to depict the relationship between all of these parts. They are often used by professionals in the fields mentioned to illustrate a process that takes place in the plants. The symbols and notation used in process flow charts are often more complex than that of a regular flowchart.
Proper documentation of the complex processes is a major benefit of using process flow diagrams. This can facilitate analysis of the process, enhance team communication, and offer a standardized representation of a process that will lead to increased efficiency.
What Information does a Process Flow Diagram include?
- In general, a process flow diagram includes process piping, major equipment, connections with other systems, control valves, major bypass and recirculation streams, and operational data.
- All the major equipment in the process will be displayed on the diagram together with a description of the equipment.
- All process flow streams will be shown with a number, together with a description of the process conditions and chemical composition of each stream.
- All utility streams supplied to major equipment that provides a process function will be shown.
- Basic control loops will be displayed to indicate the control strategy for operating the process.
Benefits of Using Process Flow Diagrams
The process flow diagram provides a visual representation of the steps and instruments in a process. Constructing a process flow diagram is often one of the first activities of a process improvement effort, because of the following benefits:
- Gives everyone a clear understanding of the whole process.
- Increases production efficiency.
- Helps to identify relationship between different steps.
- Facilitates teamwork and communication.
- Keeps everyone on the same page.

An all-in-one platform for 210+ diagrams.
・ Simple alternative to Visio
・ 26k+ symbols
・ 10K+ free templates
・ 10+ AI diagram generators


How to Create a Process Flow Diagram Effortlessly?
Start with the Exact PFD Template
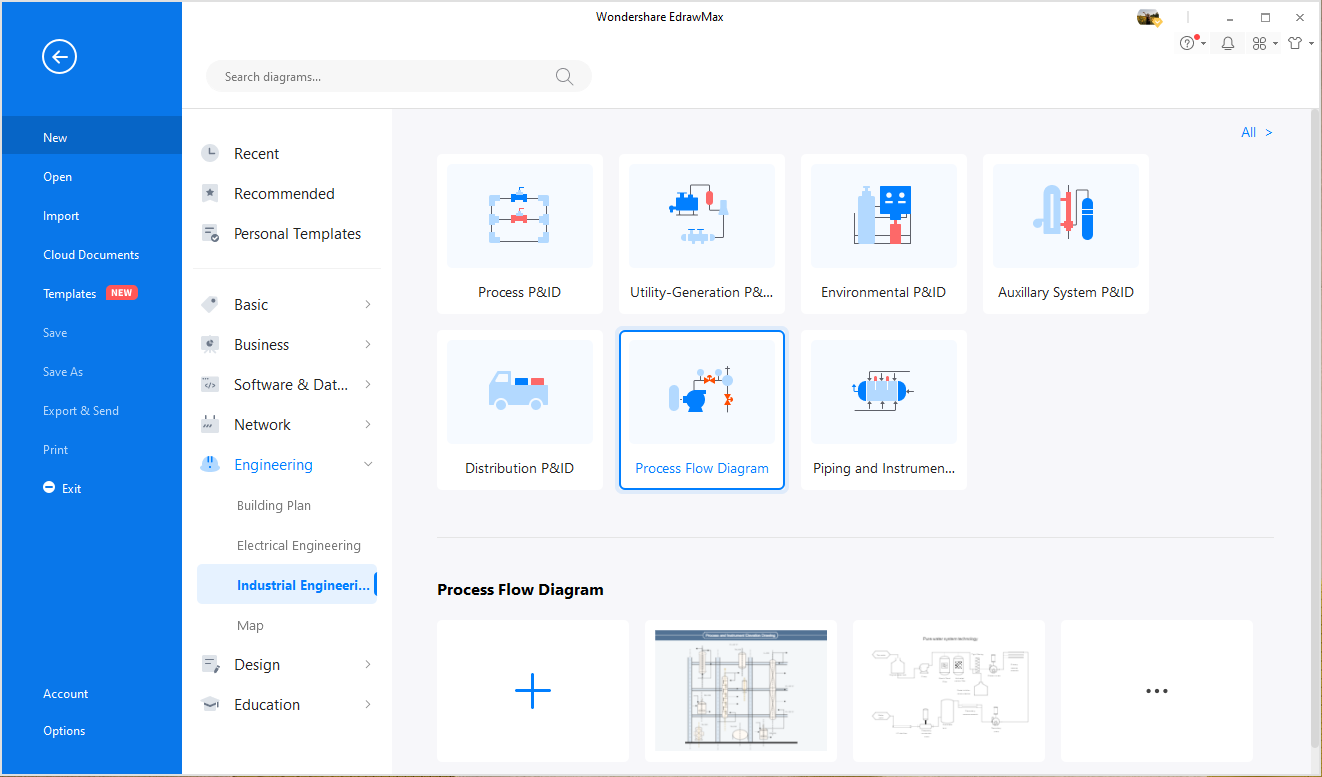
The Process Flow Diagram Template helps you easily create process flow diagrams using extensive built-in symbols. Open EdrawMax, find [Process Flow Diagram] template from [Industrial Engineering] Category on the starting page and double-click to enter the drawing page. You will discover abundant symbols and easy-to-use tools available for process flow diagrams.
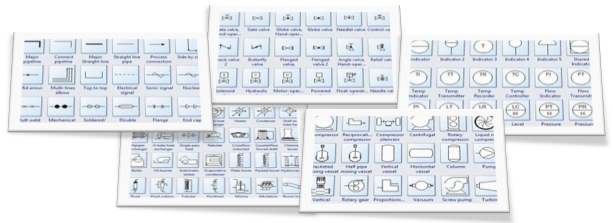
Use Standard Built-in Symbols
A large collection of standard symbols for process flow diagrams are provided by EdrawMax, including plenty of instrument shapes, indicator, odometer, pressure gauge, flowmeter, thermometer, shared indicator, temp transmitter, temp recorder, temp controller, flow indicator, flow transmitter, flow recorder, flow controller, level indicator, etc. All the symbols are in vector format and with high quality. Simply drag and drop the one you need from the library pane.
Customizing PFD Templates
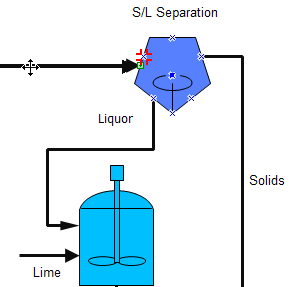
Go to the Library pane on the left side of the canvas. From Equipment group, drag equipment shapes onto the canvas. Use pipelines to connect the equipments.
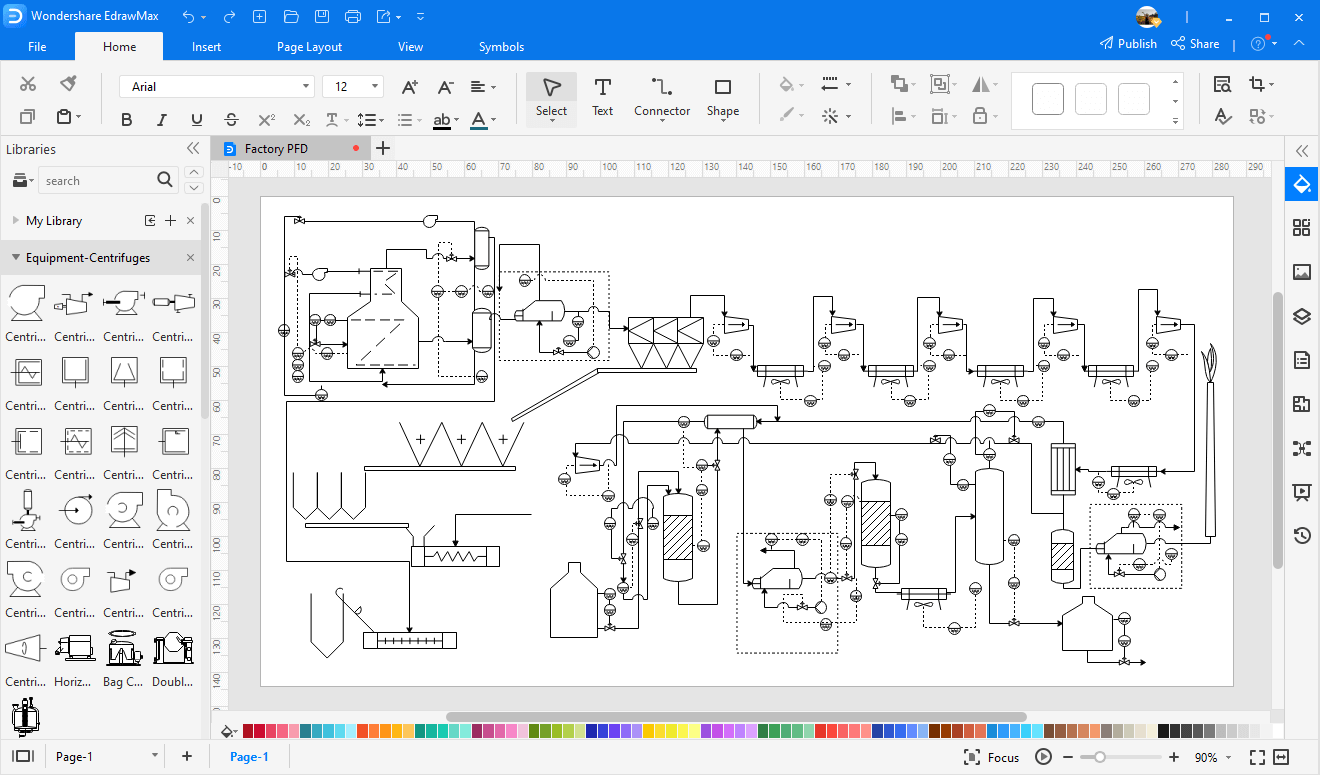
- Drag a pipeline from the Connection Shape onto the drawing page. Position an endpoint with an equipment shape. Connection points (blue x) will appear on the equipment shape. You can connect with any connection point as you want. When the endpoint turns red, it means it's glued to the equipment shape. Note: If you need, connection point can be created through Connection Point Tool under Home tab.
- Drag the other endpoint to another equipment shape as above.
- Pipeline style is changeable if you need a special line weight or arrow direction. Go to Home tab Line button to set the pipeline style.
- You can add valves and instruments in the same way.
- Rotate a shape through the rotation handle when it's selected.
- Reposition a shape by dragging it to the required place.
- Add data to a component by double clicking on it.
Export and Print Your PFD
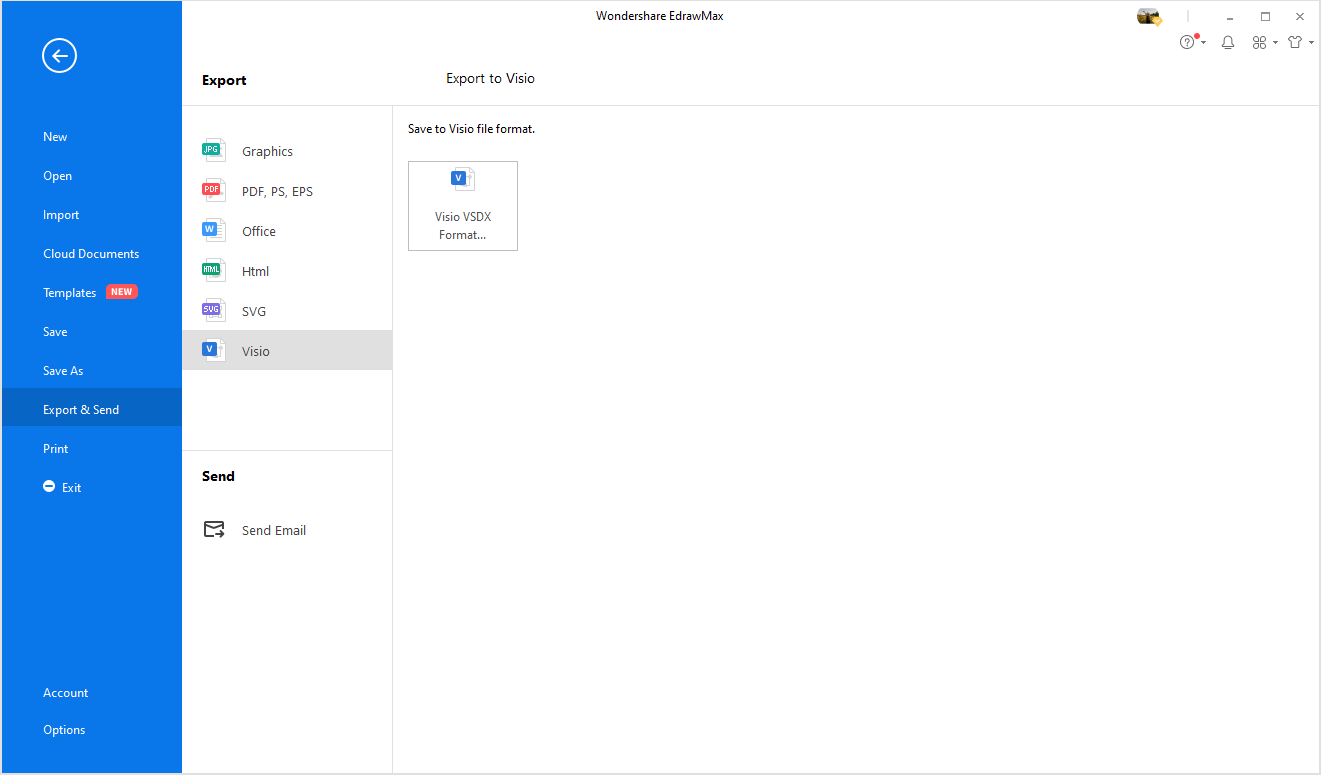
Export: EdrawMax offers support for exporting your diagram to various formats, including Microsoft Office, PDF, and many other graphic formats. On the File menu, point to [Export & Send] for export options.
Print: When a process flow diagram is done, it's easy to print and share with more people. On the file menu, point to Print to set for print options. You can change settings with fewer clicks and see the print preview in real time.
Process Flow Diagram Examples
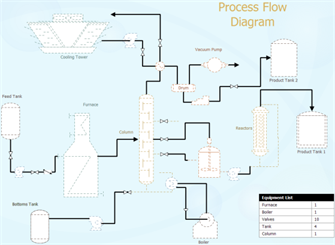
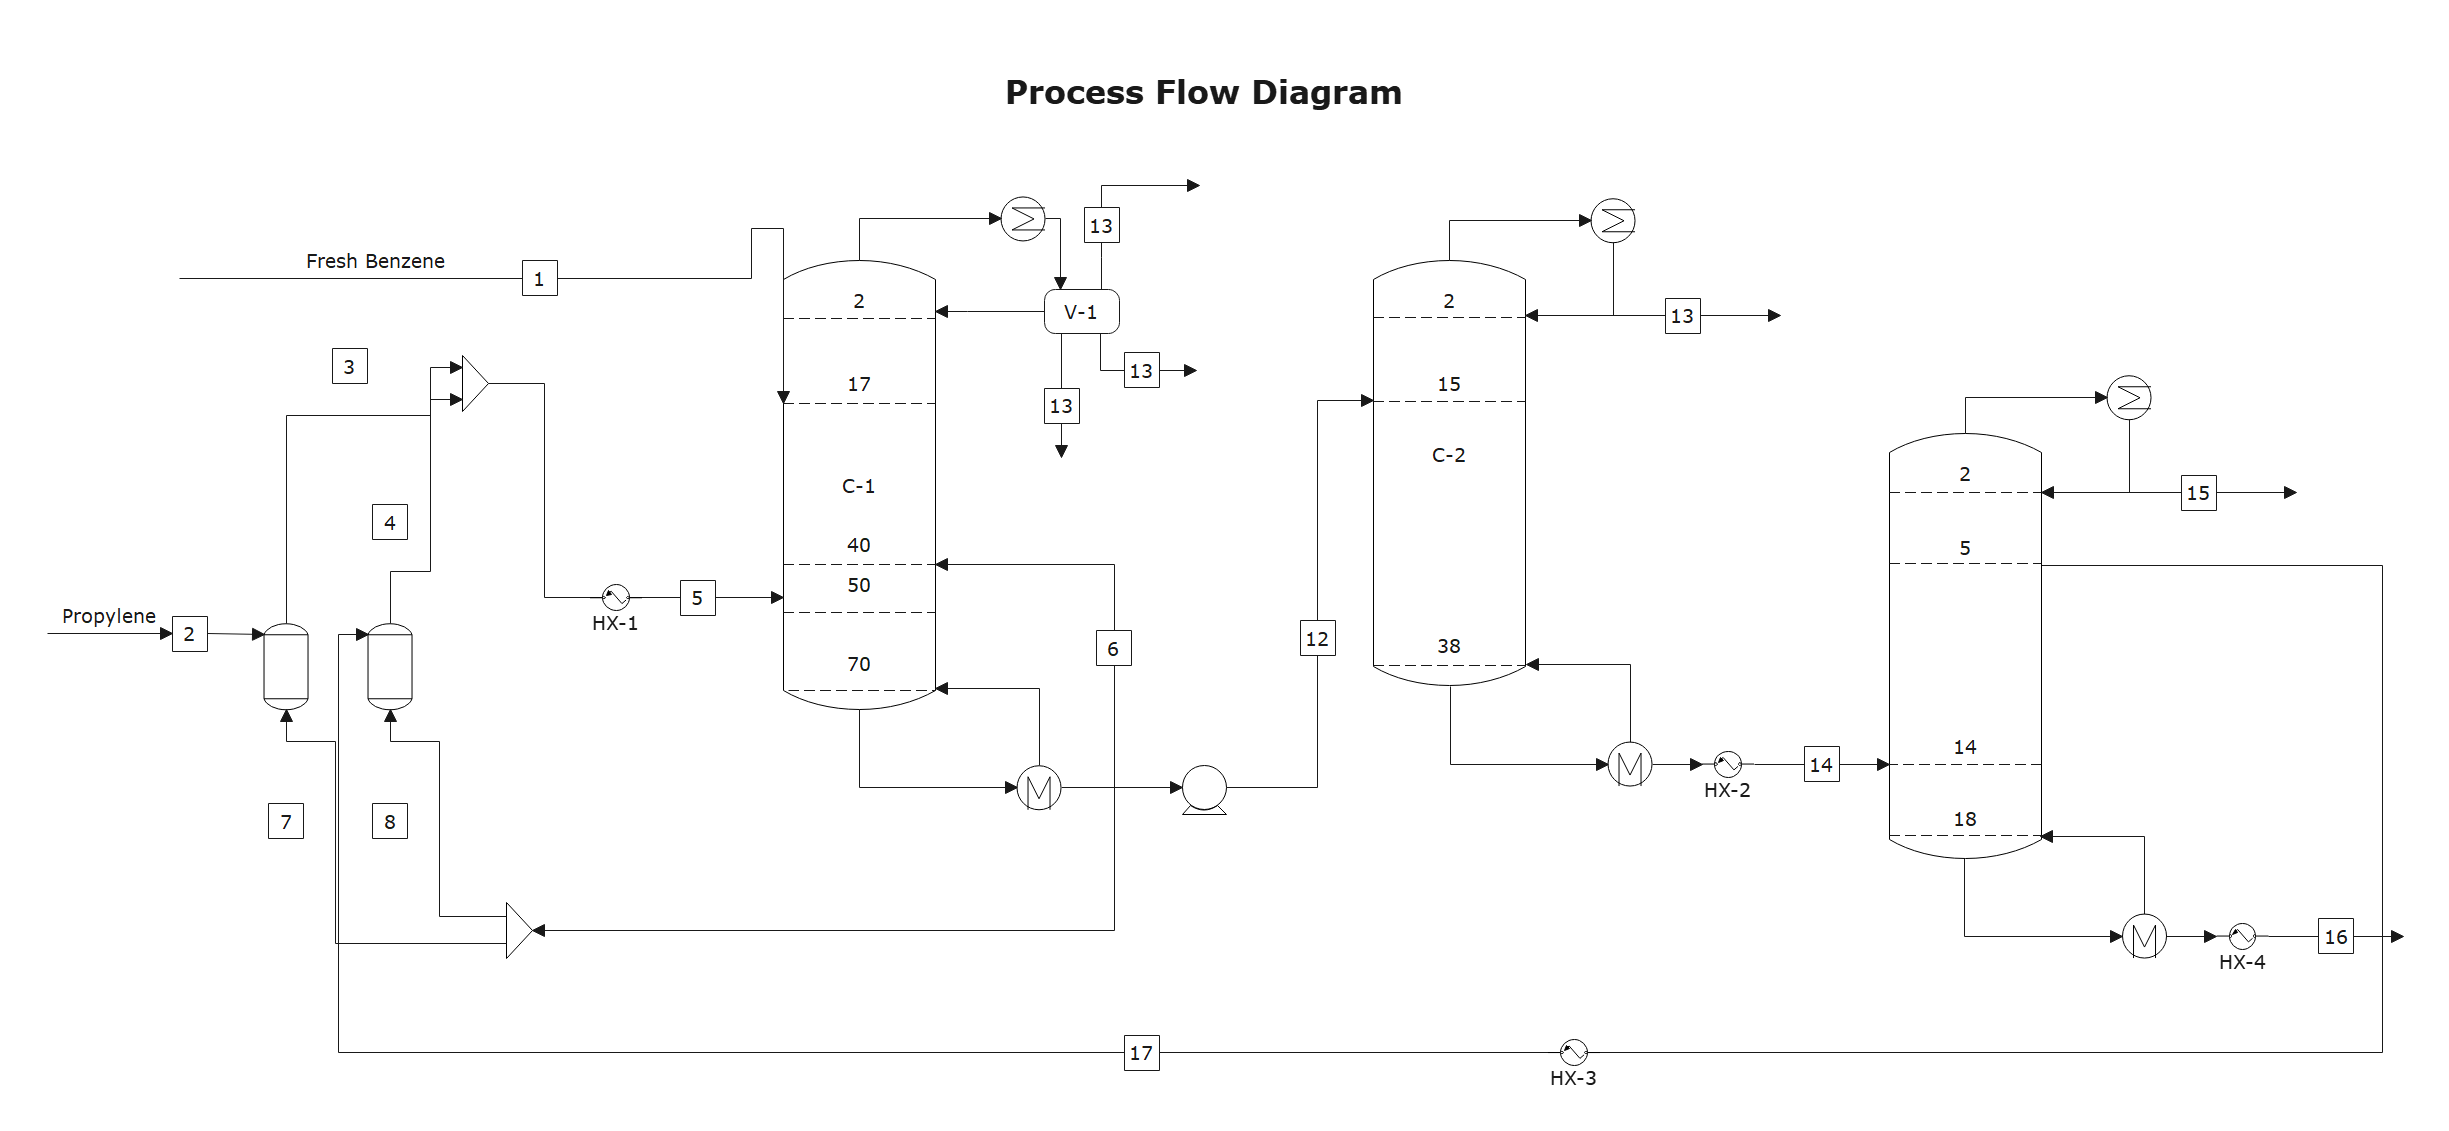
Process Flow Diagram
A process flow diagram is used in chemical and process engineering to illustrate how parts and components of an industrial plant work in relation to each other. This example shows how a plant processes Fresh Benzene and Propylene.
Wastewater Treatment Process Flow Diagram
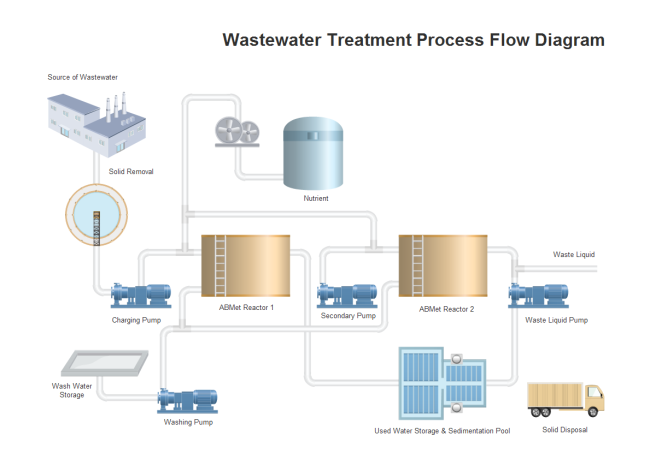
To make wastewater able for drinking and for other household chore purposes, wastewater treatment plants use a combination of physical and biological processes for purification known as Wastewater treatment or Sewage treatment, these treatment processes are broken down into five major phases including:
- Preliminary treatment
- Primary treatment
- Secondary treatment
- Disinfection treatment
- Sludge treatment
Preliminary Treatment:
It is a physical process by using large bars or screens like equipment-screeners, grit chambers, and skimming tanks to remove large pieces of garbage such as leaves, papers, rags and other inorganic solids like sand and grit from the incoming wastewater.
By removing large trash in this preliminary step, this helps to protect the main system and equipment from potential damage. The three major types of components involved in Preliminary treatment involves:
- Screeners
- Grit chambers
- Skimming tanks
Primary Treatment:
After moving from the Preliminary step, the waste water then moves to the sedimentation tanks where the flow of water is slowed down, the objective is to remove fine suspended organic solids that cannot be removed in the initial step. The heavier solids settle to the bottom of the tank, while lighter particles float to the top.
The settled solids are then pumped to another area for additional processing, whereas the floating solid and impurities are skimmed off. This process is often done twice to ensure that all the inorganic solid is separated from the wastewater before moving to the next step.
Secondary Treatment:
After moving from the sedimentation process the waste water then enters the aeration tanks for biological treatment (sludge process) or secondary treatment.
Then oxygen is introduced in the tanks that revive the growth of bacteria, algae, fungi, protozoa, rotifers, nematodes which naturally exist in the wastewater that decomposes the unstable organic matter to stable inorganic forms.
The treated water then moves towards the disinfection process.
Disinfection Treatment:
To disinfect the water chlorine is added to kill harmful disease-causing organisms. The treated water is also called “effluent”. The effluent then moves forward for sludge treatment.
Sludge Treatment:
In Sludge treatment it combines the primary sludge and secondary sludge both, which are concentrated in this phase in two steps:
- Thickening
- Digestion
The thickening stage further allows separation of water from inorganic solids. The water is reinstated into earlier phases of the wastewater purification process. The objective of repetition of process is to ensure that all the waste material should be separated from treated water.
The solids are then moved into the “digestion” stage. The digestion tanks are anaerobic which means that they are free from oxygen.
In the Digestion stage the sludge is then heated to revive growth of anaerobic bacteria, which transforms the thickened sludge into water, carbon dioxide and methane gas.
Asphalt Production Process Flow Diagram
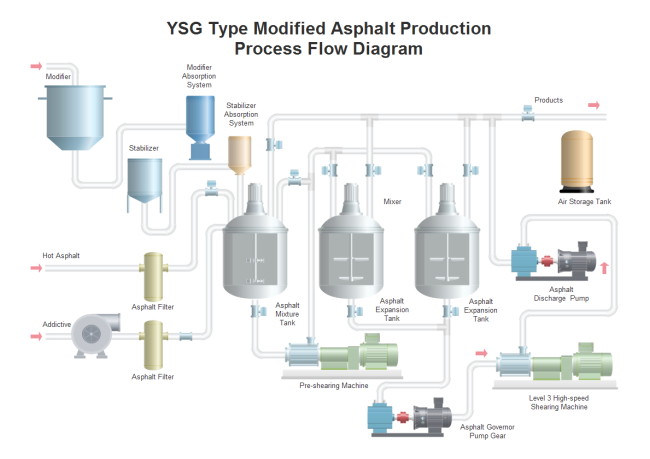
Asphalt plants or asphalt mixing plants or hot mix plants, are equipment or a setup that can combine aggregates and bitumen to manufacture asphalt mix for the purpose of road paving or road carpeting.
The asphalt mix is used for carpeting highways, municipal roads, parking lots, expressways, airport runways etc.
- Aggregates are fed by belt conveyor from the cold feeders to a rotary drying drum where the moisture is eliminated.
- It is then elevated to a set of screens where it is divided into several component sizes and stored in hot aggregate storage drums.
- These aggregates are then proportioned into a weighing bowl.
- It is then moved into a pug mill and mixed.
- The pug mill spills open at the end of this process and the finished asphalt mix is discharged into a container.
Chemistry Process Flow Diagram
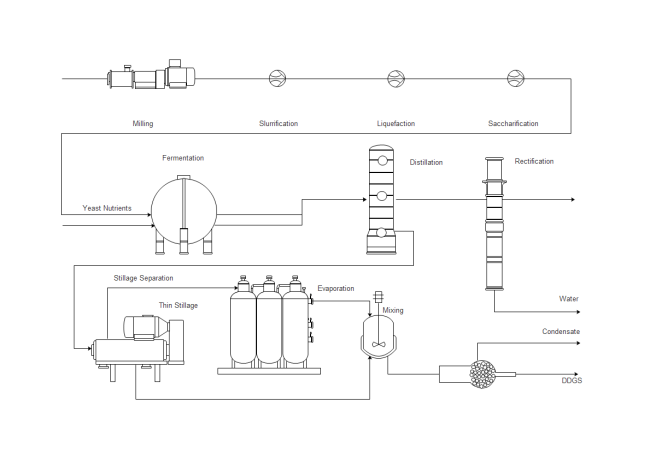
The purpose of the Process flow diagram or process flowchart in a Chemical process is to build the visual image of the basic idea of the whole chemical process from scratch to end. A Chemical Process Flow diagram is a flowchart, from which chemists or engineers can easily map out the general phases or steps of the processes and plant equipment.
Process flow diagrams are used in process or manufacturing engineering and chemical industry where there is a requirement of portraying the relationship between major components or parts of the plant.
Process flow diagrams for single unit plants or multiple units vary in their structure and implementation. Process flow diagrams for multiple units avoid unnecessary information and are known as the schematic flow diagrams or block flow diagrams.
The Best Process Flow Diagram Software
- EdrawMax has built in a set of nice looking themes with advanced effects. It's easy to change the whole diagram by changing the active theme with just a few clicks. You don't have to be professional in designing.
- All Edraw documents are vector graphic files with high clarity and available for reviewing and modifying.
- A set of smart tools are provided for automatic formatting. You can easily arrange, rotate, group and align objects with these smart tools.
- EdrawMax offers various customization options, using which you can adjust line width, line color, line style, font size, font style, text color, and much more.
- It's easy to add photos, images and edit text fields.
More Related
Process Flowchart VS Use Case Diagram


