Best and Easiest Gauges Chart Software for Linux
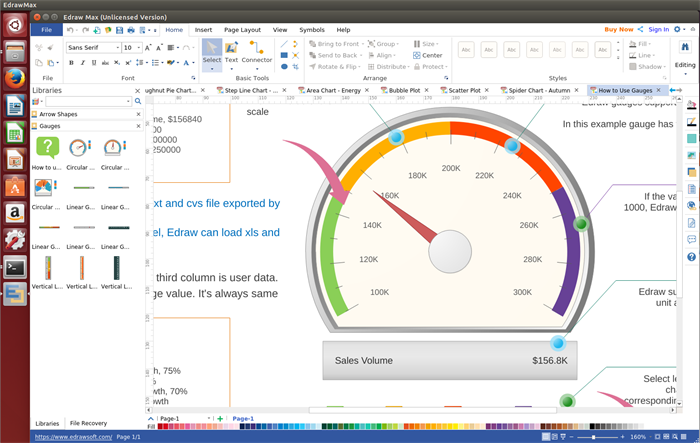
A gauges chart is also known as dial chart or speedometer chart, which visualizes data in a way that resembles a real-life speedometer needle or a regular gauge. It consists of a gauge axis(which contains the range, color ranges, and intervals markers), needles, and a center pivot point.
Introduction of Great Linux Gauges Chart Software
For people who are looking for a gauges chart software which can perfectly work on Linux, it is pretty hard for them to find a better option than Edraw gauges chart software for Linux. Edraw is such a humanized gauges chart maker that it has prepared almost everything users may need during the chart making process, such as gauges chart shapes, templates and even drawing tool, etc.
System Requirements
Compatible with the most popular Linux distributions such as Debian, Ubuntu, Fedora, CentOS, OpenSUSE, Mint, Knoppix, RedHat, Gentoo and More.
Must-Have Features of Gauges Chart Software for Linux
Here lists several superior features of our Linux chart software that preferred by most users. Welcome to download and try it for free.
Free Download Gauges Chart Software to Create Various Gauges Charts on Linux Easily:
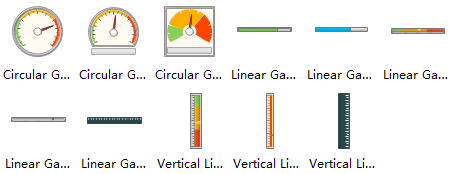
Editable Gauges Shapes for Gauges Chart Design
Following are gauges shapes provided by our gauges chart software for Linux. All of them are royalty free and easy to edit, such as changing the colors, dimensions, group/ungroup and so on. Users can edit them to fit different needs.
How to Create Gauges Chart on Linux Quickly
Our Linux gauges chart software enables users to create a professional gauges chart on Linux in minutes.
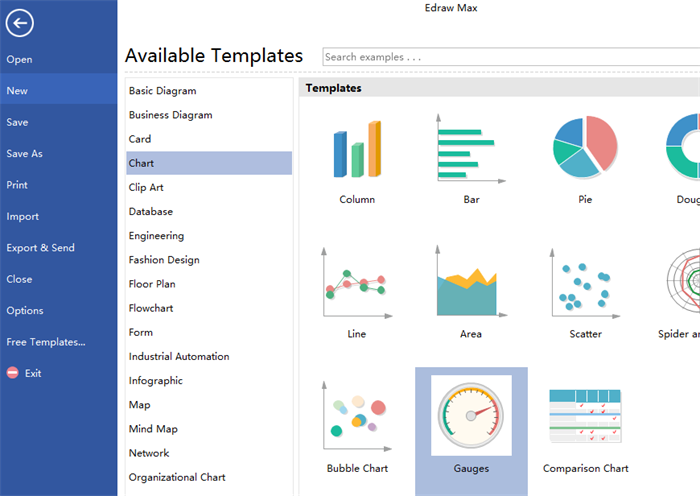
- Firstly, start the software, open a blank drawing page by double clicking Gauges icon under chart templates.
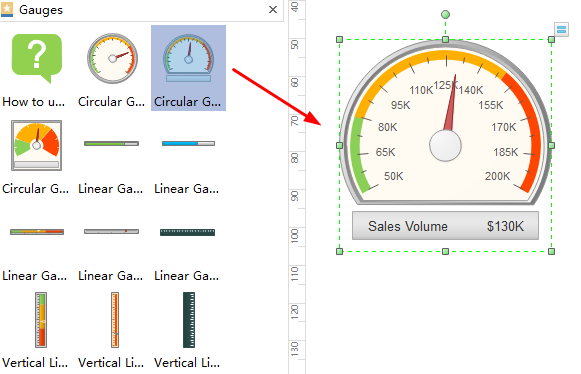
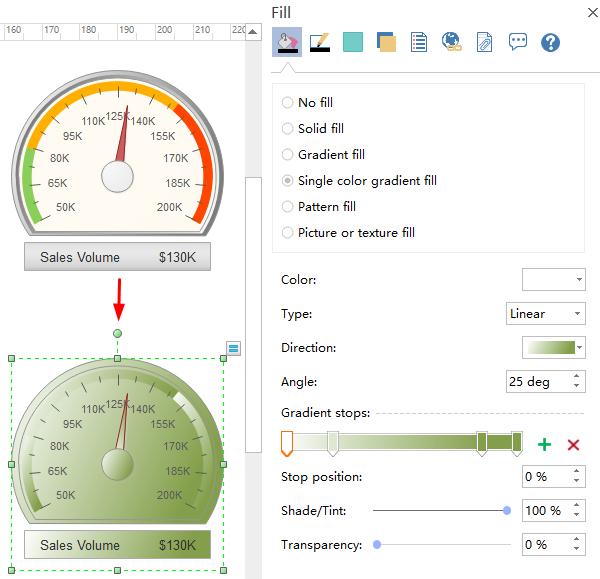
- Secondly, drag and drop a gauges shape on the drawing page, set the gauge data, range number and range data by clicking the floating button.
- Thirdly, go to the right sidebar and set the chart color you like.
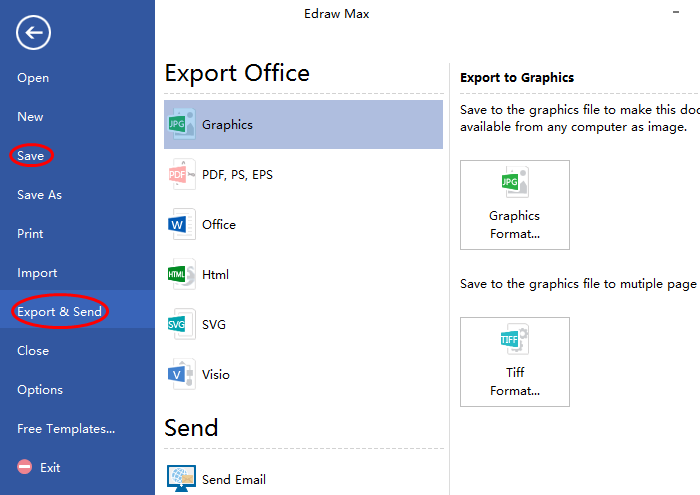
- Lastly, save or export the gauges chart as you wish by clicking Save icon or Export & Send icon.
Click How to Create Gauges Charts to view detailed steps or click Video Tutorial - How to Create a Gauges Chart watch video tutorial
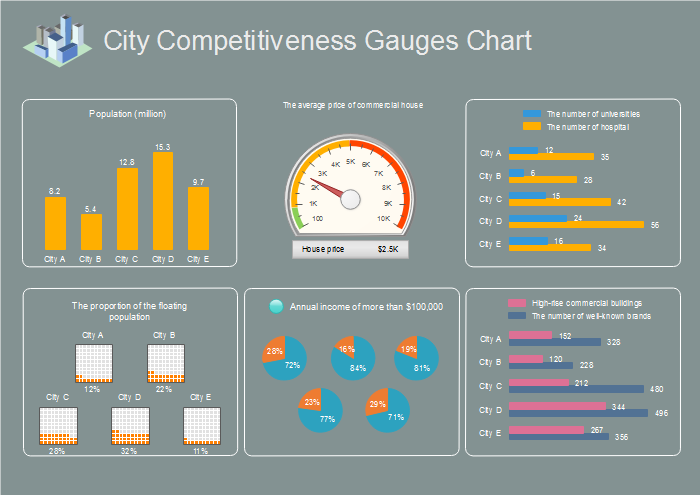
Gauges Chart Examples Created by Linux Gauges Chart Software
Here attached a gauges chart example for your reference. It is a city competitive gauges with population, universities, hospitals, incomes and some other data clearly presented. It is quite easy to know which city is more competitive from this chart. Welcome to download this gauges chart and edit it to your own.
Related Articles:


