Histogram Maker
Create professional histograms for free with easy-to-edit templates and spreadsheet editor.
Trusted By Over 30 Million Users & Leading Brands


Why EdrawMax to Make Your Histograms?
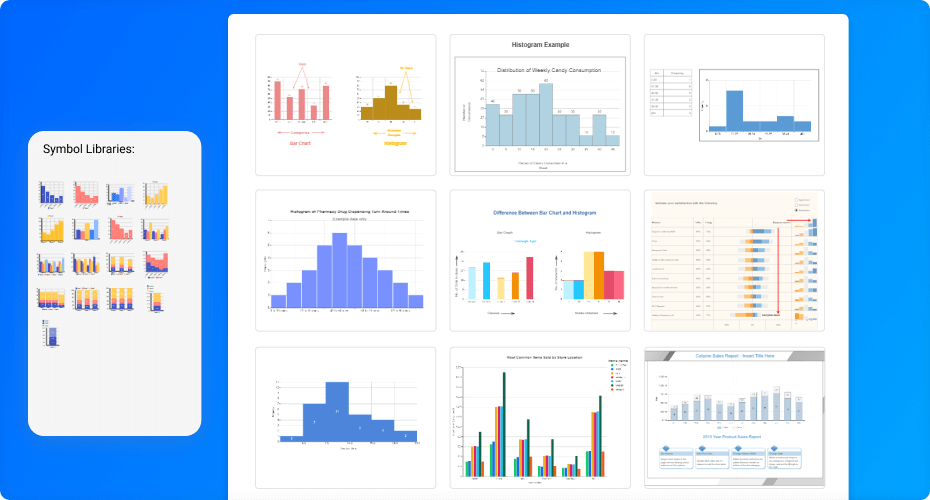
Histograms for every need
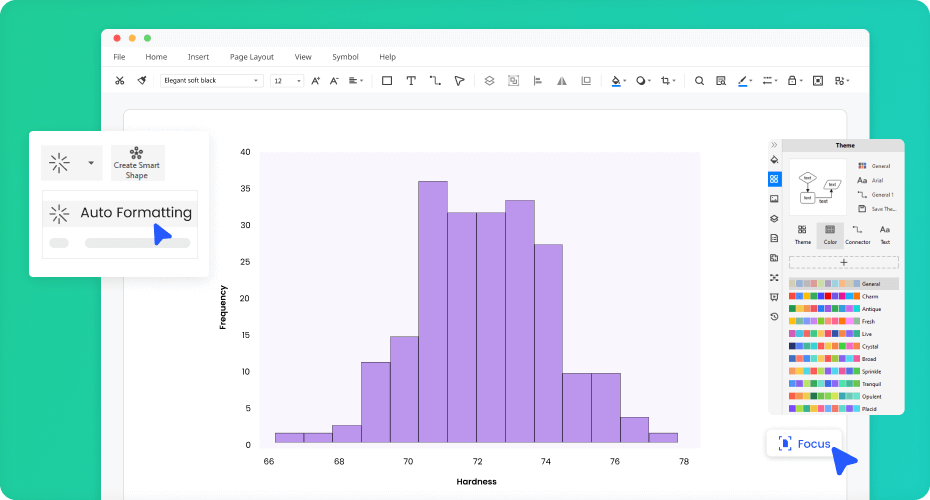
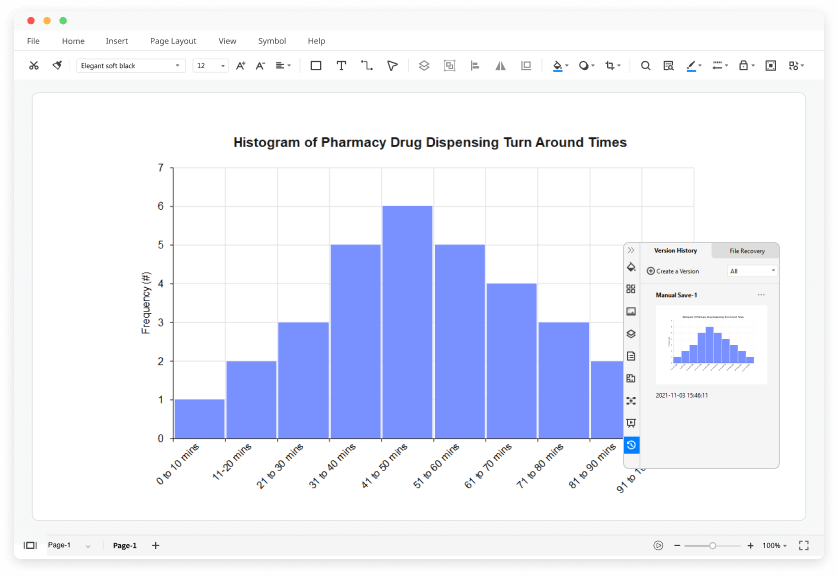
Easily create histograms in EdrawMax
Store and sharing simple enough
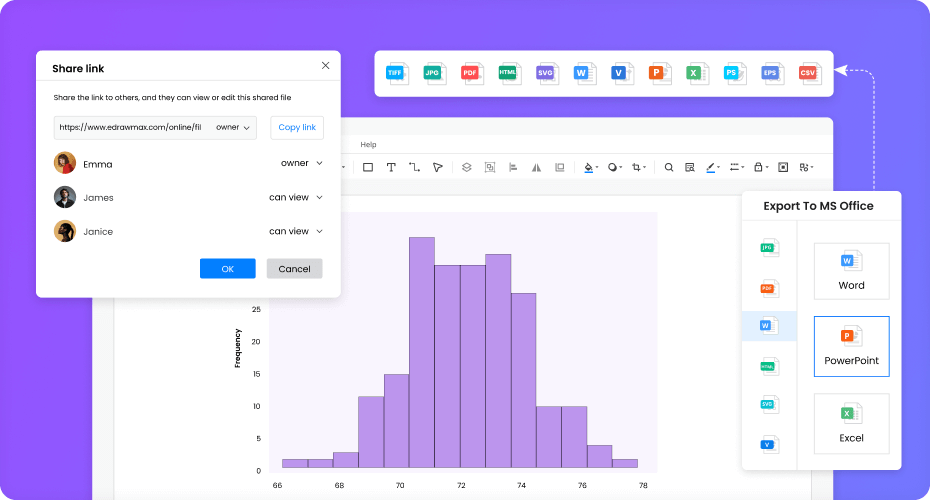
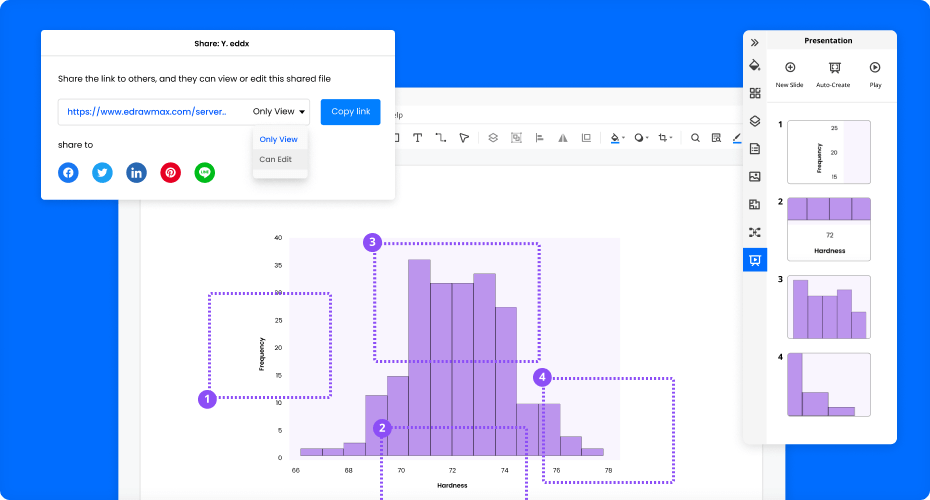
Print, secure, and present in EdrawMax
More Features Of Histogram Maker
Visio files import and export
Customized fonts and shapes
Insert images and attachments
Infinitive canvas
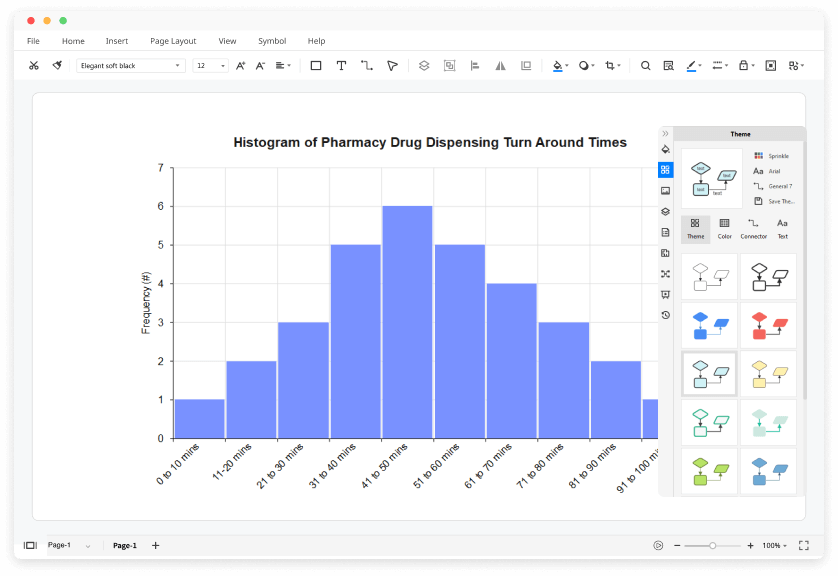
Various color theme
File encryption and file backup
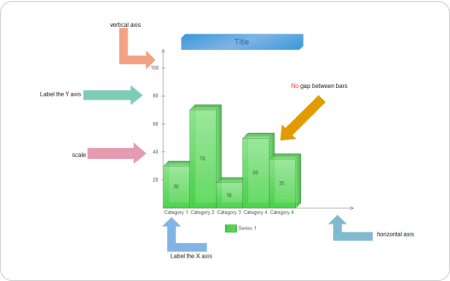
How to Make a Histogram?
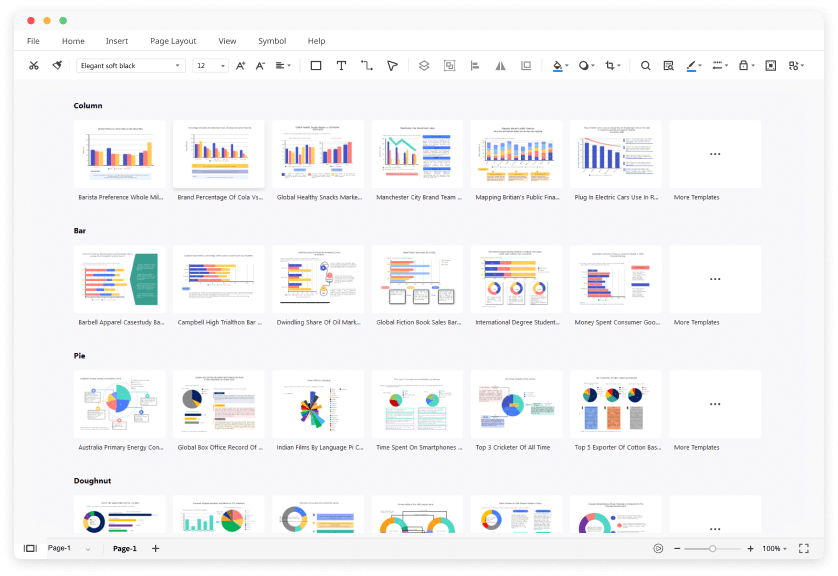
Edraw Histogram Templates
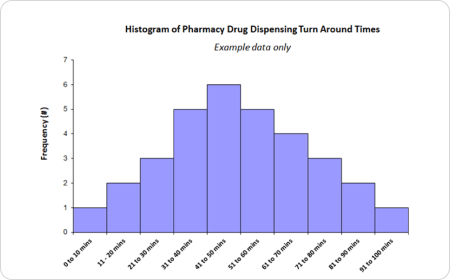
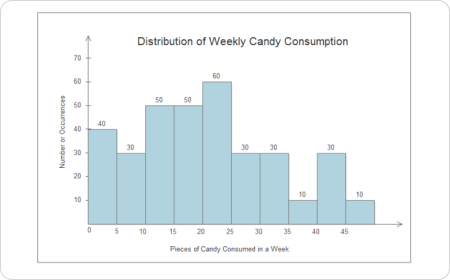
Histogram Graph
Use this template to create a histogram graph, where the x-axis represents the range of data and the y-axis represents the frequency of that range.
Histogram Excel
If you're a Microsoft Excel user, this is the histogram template! This template allows you to create a histogram of data in EdrawMax and export it as an Excel file.
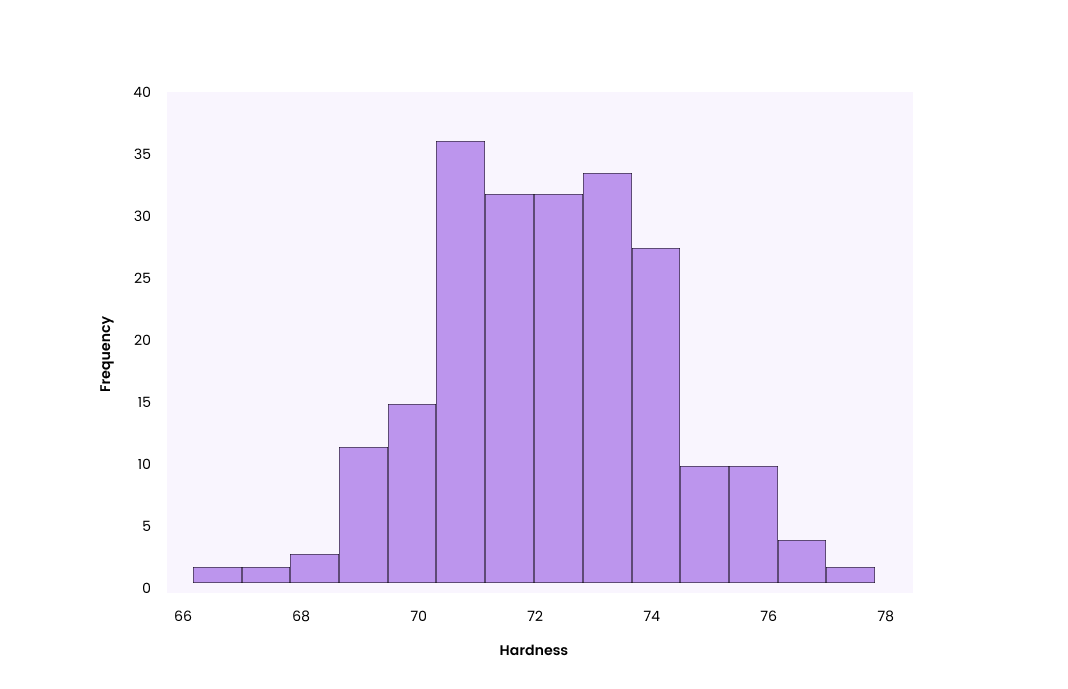
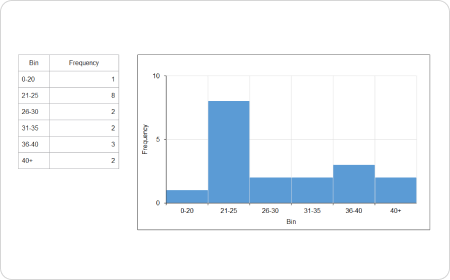
Histogram Example
To get started, you must go through a histogram example to understand what a histogram looks like.
Histogram Chart
Use EdrawMax to create a template for the histogram chart you'll use in your next project. First, open the chart template and select the type of chart you'd like to create.
Histogram in Statistics
The histogram in statistics is a unique application for data analysis and visualization.
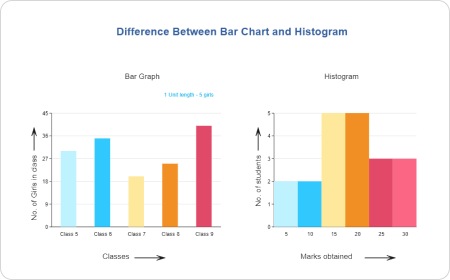
Histogram and Bar Graph
The histogram and bar graph templates allow you to easily create a histogram or bar graph from scratch and edit the existing one.
Histogram FAQs

Does EdrawMax have any free histogram templates?
Except for the pre-made histogram templates in EdrawMax, you can download and customize templates from our Template Community. All the community-made templates are free to use for Edrawers.
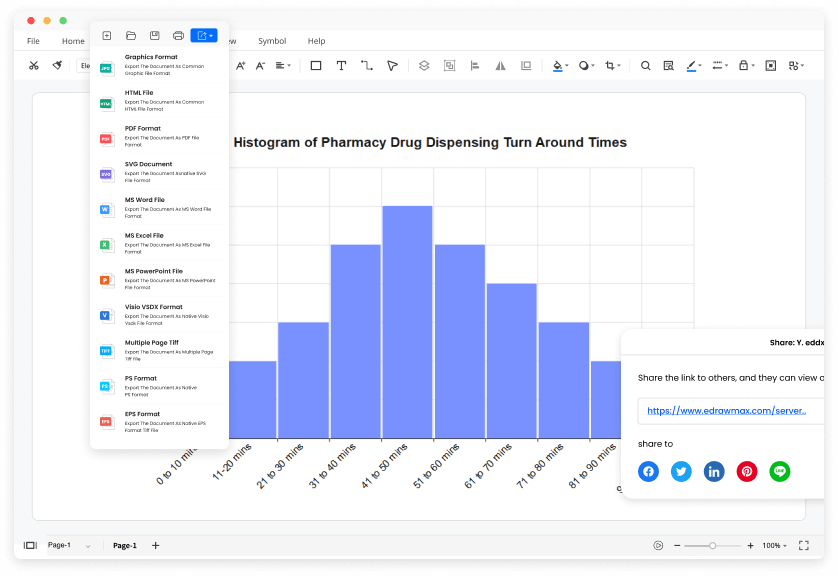
How can I share my histograms with others who don't use EdrawMax?
When your histogram is complete, you can post it on social media, publish on Edraw Template Community, or export the file as Word, Excel, PowerPoint, Visio, PDF, SVG, PNG and JPG. EdrawMax is dedicated to delivering a superior user experience.
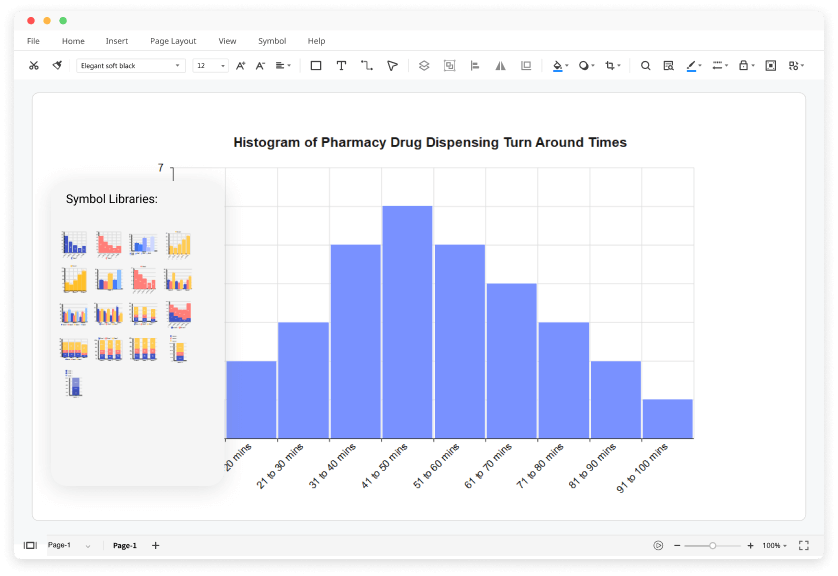
How can I find histogram plot symbols that I need?
No worries. You can find histogram symbols by opening and searching in the preset symbol libraries of EdrawMax.
How can I create a histogram from scratch?
You can create a histogram plot from scratch by dragging and dropping symbols from the libraries and customizing colors, fonts, lines, etc. All the symbols in EdrawMax are vector, editable, and catered to different types of histograms.
Is EdrawMax's histogram maker free?
YES! It is free to create different histograms in EdrawMax. There are free templates, symbols, and easy-to-use editing tools for making histograms. Just download it and try EdrawMax now. You will love it right now.
More Resources
Unlock your diagram possibilities by exploring more diagram makers here.
Find more ideas, tips and knowledge to help create histograms.
Need help? Find the instruction or contact support here.
