Flowchart Maker
Visualize the flow of every decision and system with a large variety of flowchart templates.

Trusted By Over 30 Million Users & Leading Brands


Why EdrawMax to Draw Your Flowcharts?
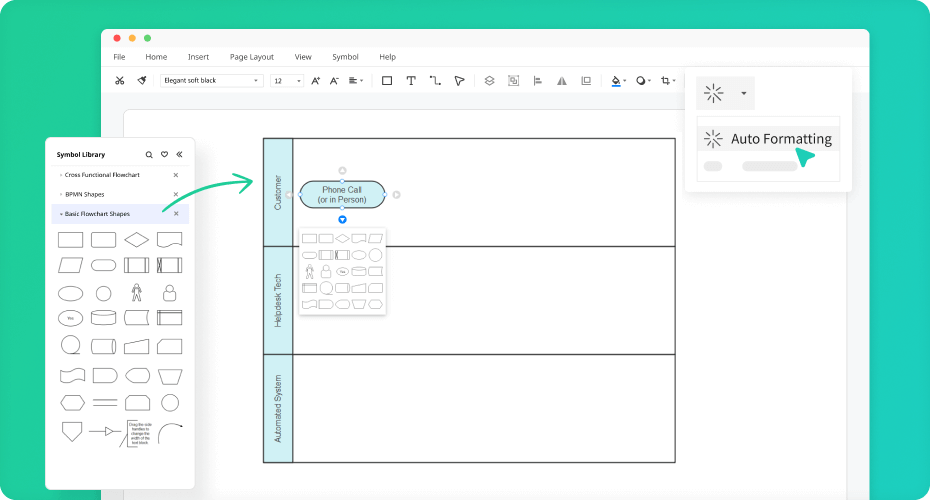
Flow diagramming start easily
Create flowcharts without much help
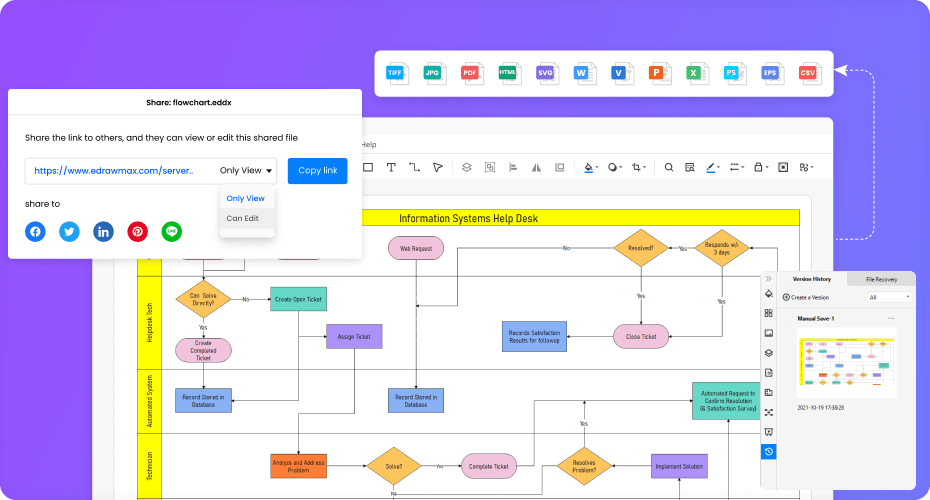
Collaboration with team effortlessly
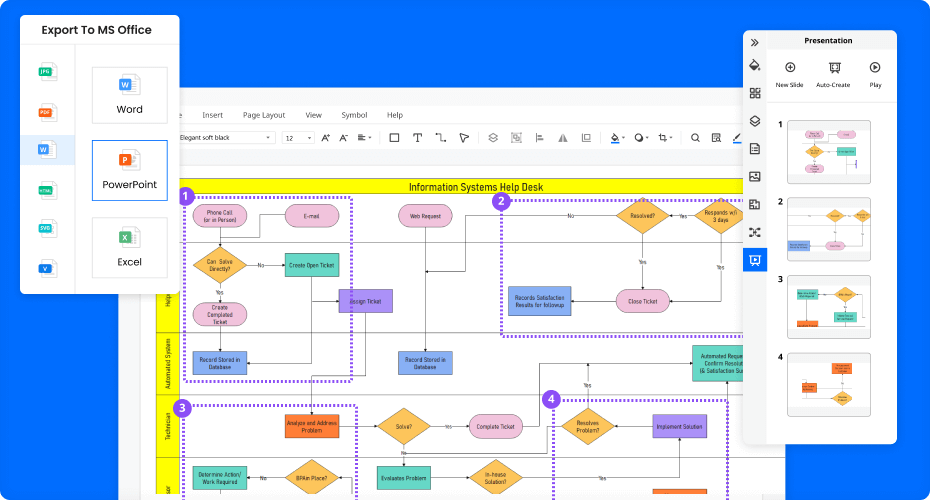
More Features Of Flowchart Maker
Visio files import and export
Customized fonts and shapes
Insert images and attachments
Infinitive canvas
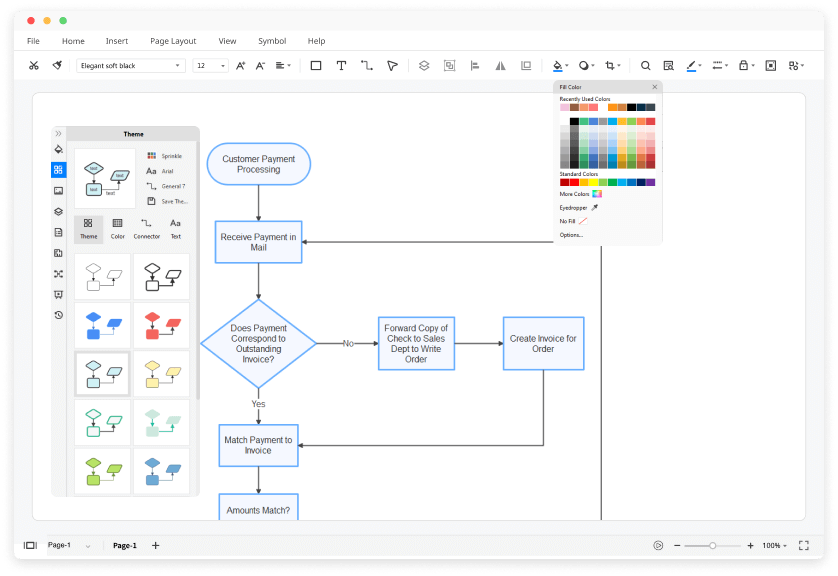
Various color theme
File encryption and file backup
How to Make a Flowchart?
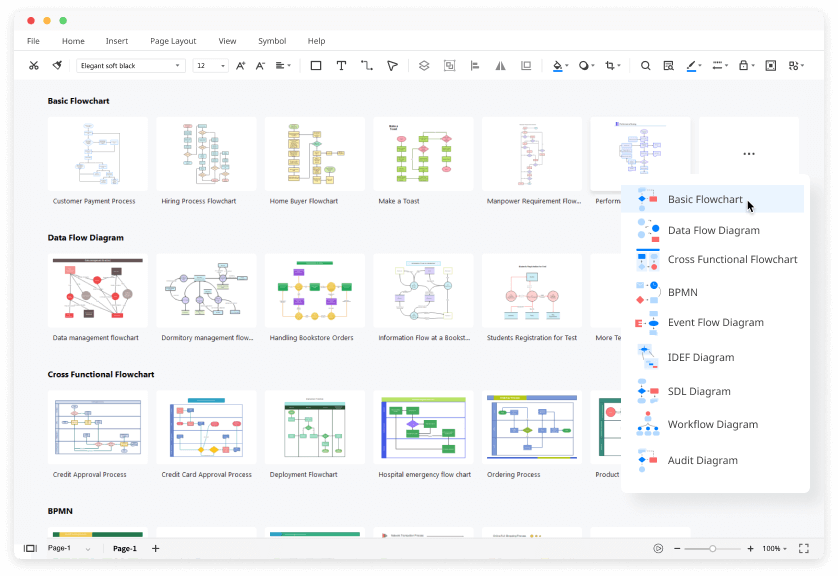
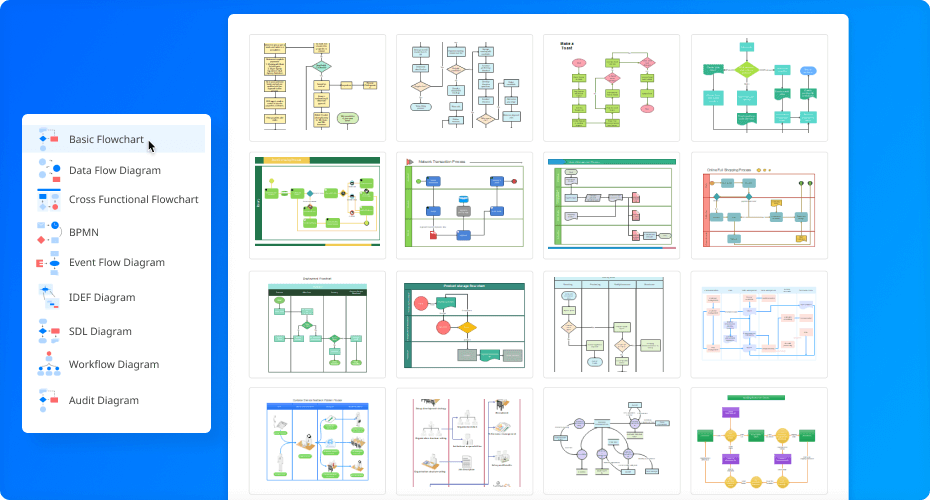
Edraw Flowchart Templates
Flowchart Example
The flowchart example shows the diagrammatic representation of an algorithm, a step-by-step approach to solving a task.
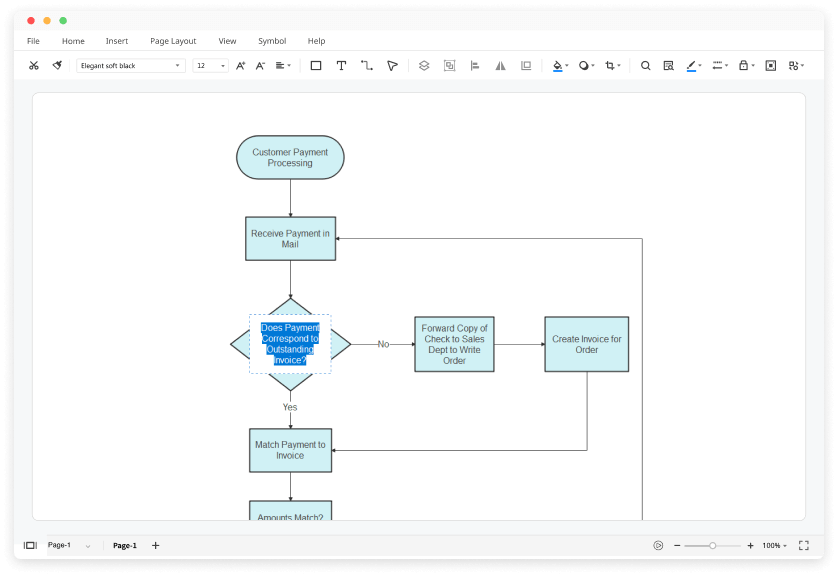
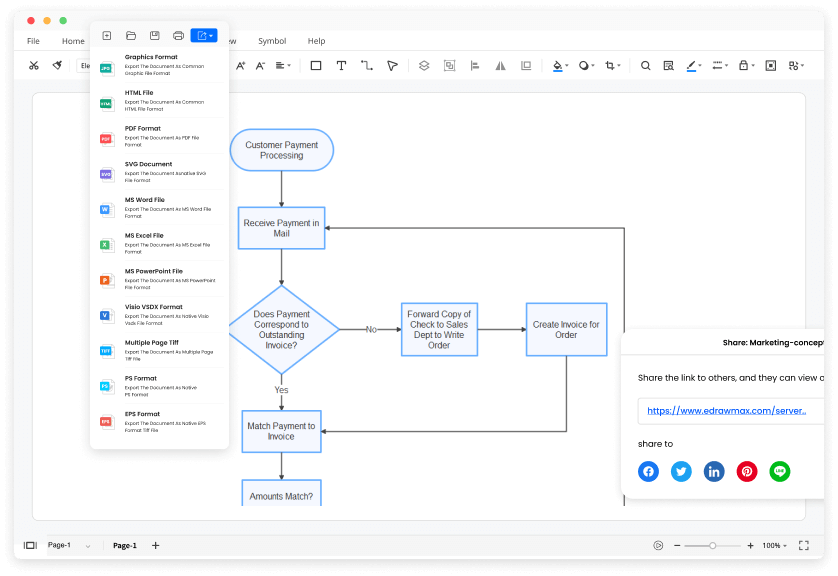
Process Flow Chart Example
A process flowchart illustrates the sequential steps of a process and the decisions needed to make the process work.
Flowchart Programming Example
A programming flowchart template is the most widely used graphical representation of an algorithm and procedural design workflows.
Workflow Diagram Example
A workflow flowchart is a basic visual layout of a business princess that represents the various tasks involved.
Algorithm Flowchart Example
An algorithm flowchart helps to clarify all the steps for solving the problem in a graphical way.
Swimlane Flowchart Example
The swimlane flowchart template is used to show which activities are performed by which organization or group of people.
Flowchart FAQs

How many types of flowchart templates do you provide?
We offer over 10 types of flowchart templates, including cross functional diagram, data flow diagram, workflow diagram, and so on. Importantly, they are all FREE! Click flowchart diagram templates collection.
Can I customize my flowchart of Visio file format in EdrawMax?
Yes. You can import your Visio files (vsd / vsdx) to EdrawMax and customize every aspect of them according to your needs. EdrawMax is the best Visio alternative you can find in the market.
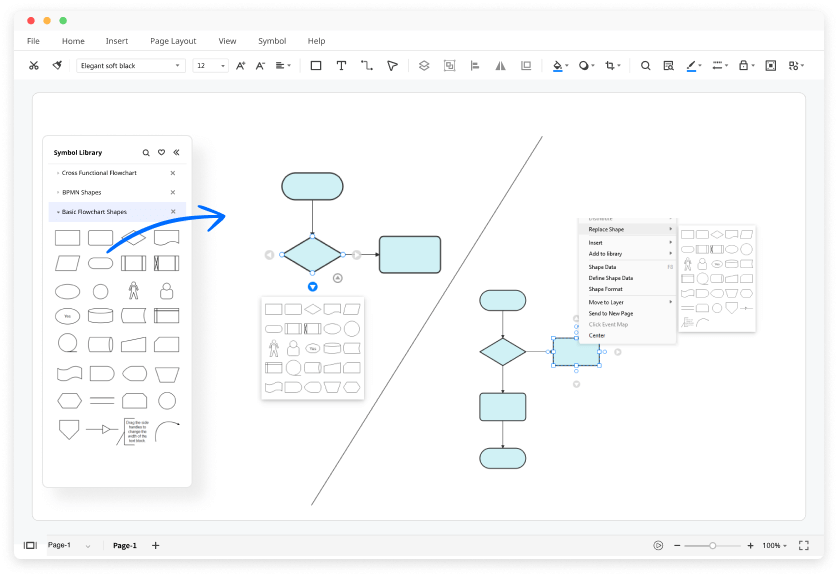
How can I find the flowchart symbols that I need?
No worries. Read this comprehensive guide of flowchart symbolsand open the symbols library in the software. All you have to do is drag and drop the symbols and notations you need to the canvas.
How can I create a flowchart from scratch?
You can create a flowchart from scratch by dragging and dropping symbols from the libraries. All the flowchart symbols in EdrawMax are industry-standard and catered to different flowchart types.
Is EdrawMax’s flowchart maker free?
YES! It is free to create different types of flowcharts in EdrawMax. There are free templates and symbols for making flowcharts. Just download it and try EdrawMax now. You will love it right now.
More Resources
Unlock your diagram possibilities by exploring more diagram makers here.
Find more ideas, tips and knowledge to help create flowcharts.
Need help? Find the instruction or contact support here.
