How to Create a Fishbone Diagram
Part 1: What is Fishbone Diagram?
Fishbone diagrams (commonly known as Ishikawa diagrams, herringbone diagrams, cause-and-effect diagrams) is a diagram used to identify the cause of an effect or a problem. Its name is derived from its fishbone shape, with the problem at the head of the diagram, and its causes along the spine of the ‘fish’.
Fishbone diagrams are best used for identifying the root cause of a problem, identifying why parts of a process aren’t working, and conducting a multi-variable analysis of a problem.
If you are looking for a diagram that shows all of the potential problems in a system or organisation simultaneously, and can identifying the root cause of a problem in a visual manner, look no further than fishbone diagrams.
Part 2: Why a Fishbone Diagram is important?
- It encourages creativity through a brainstorming process.
- It is useful in brainstorming sessions to focus conversation.
- It provides a visual image of the problem and potential categories of causes.
- It allows various categories of causes to be explored and uncovers bottlenecks in your processes.
Part 3: How to Make a Fishbone Diagram Effortlessly?
Step 1: Start EdrawMax.
Step 2: Navigate to [New]>[Management]>[Cause and Effect Diagram]
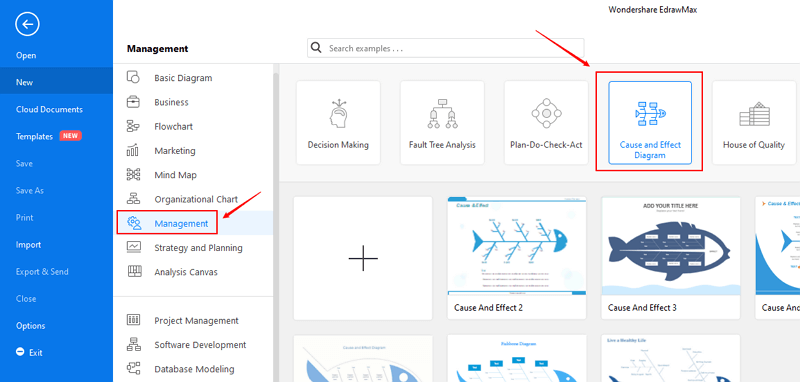
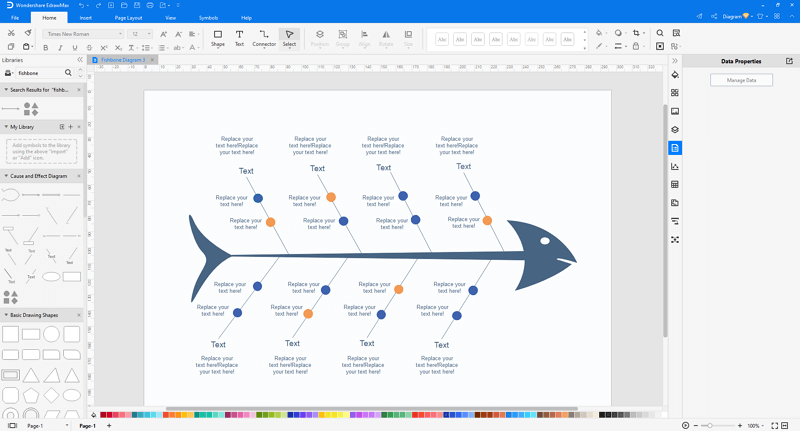
Step 3: Select one fishbone diagram template to edit on it or click the [+] sign to start from scratch.
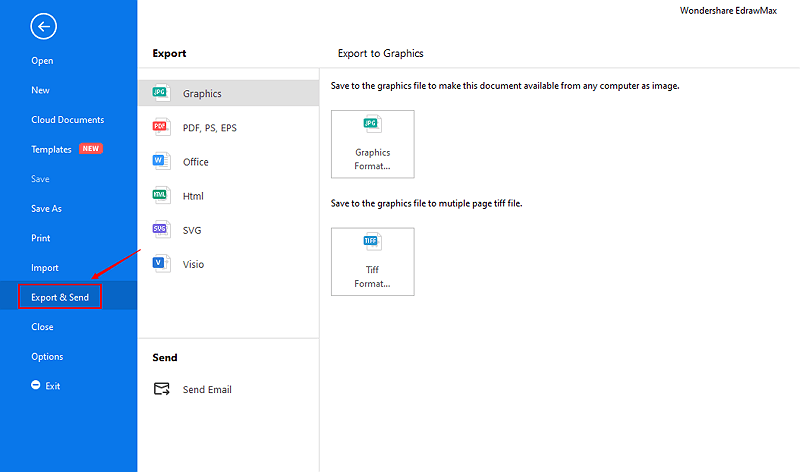
Step 4: You can export the file to Graphics, PDF, editable MS Office file, SVG and Visio vsdx file.
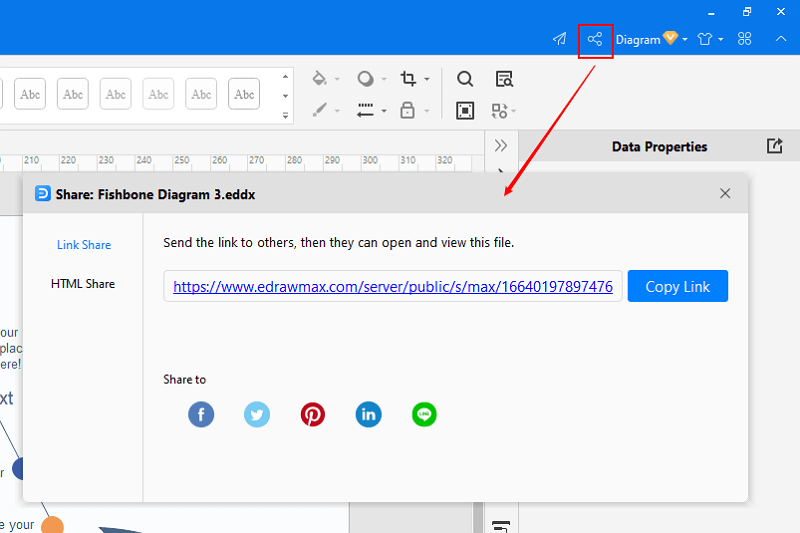
Step 5: And you can share your diagram with others via social media and online website page.
Part 4: Tips to Make a Useful Fishbone Diagram
- Use an automatic diagram software instead of hand drawing to save time and energy.
- See some examples before drawing. Understanding fishbone diagram is best achieved by studying examples.
- Learn from others. Seek their help.
- Involve as many related people as possible. Collect their ideas and advice.
- Brainstorm potential causes by asking why questions. This helps to reveal causes that are not immediately obvious.
- Classify the causes into different categories logically so that you can present them in a more structured way.
- Leave enough space between primary causes since you may need to add many secondary, thirdly level or even more causes.
Part 5: Fishbone Diagram Examples
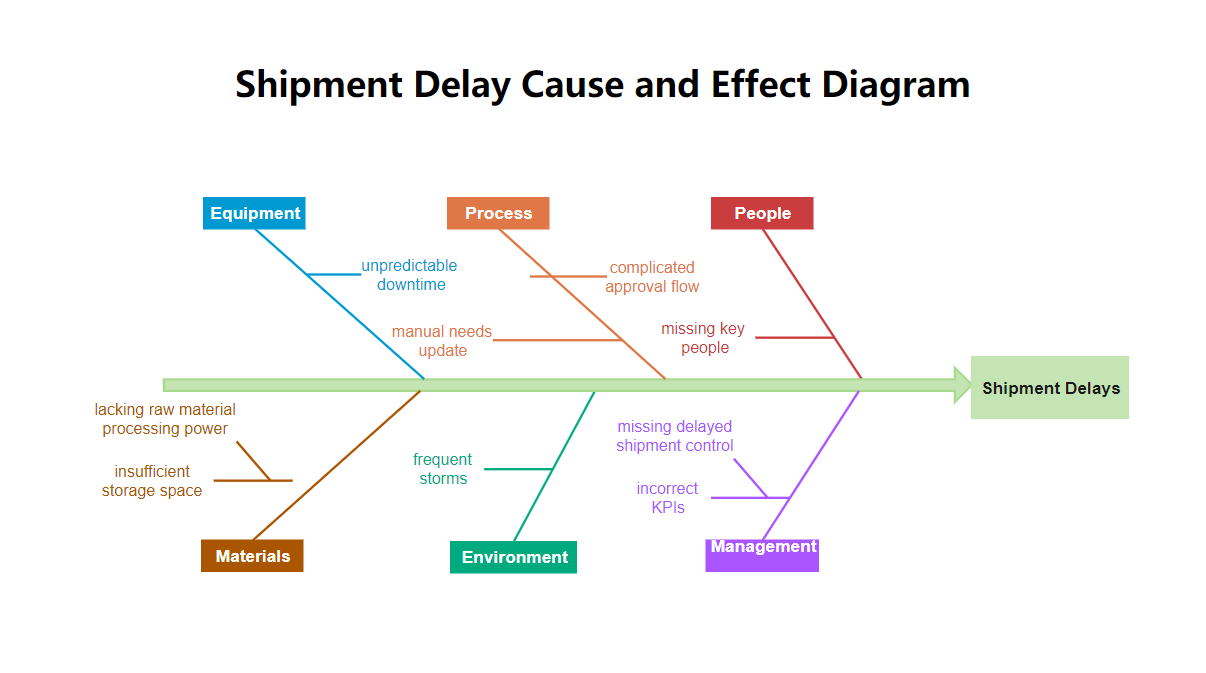
Fishbone Diagram Example 1
This is a fishbone diagram example. When the shipment is delayed, you can use this example to dig out the answers to the question: Why does this happen? Download and open this example in EdrawMax and make a cause and effect diagram by yourself easily.
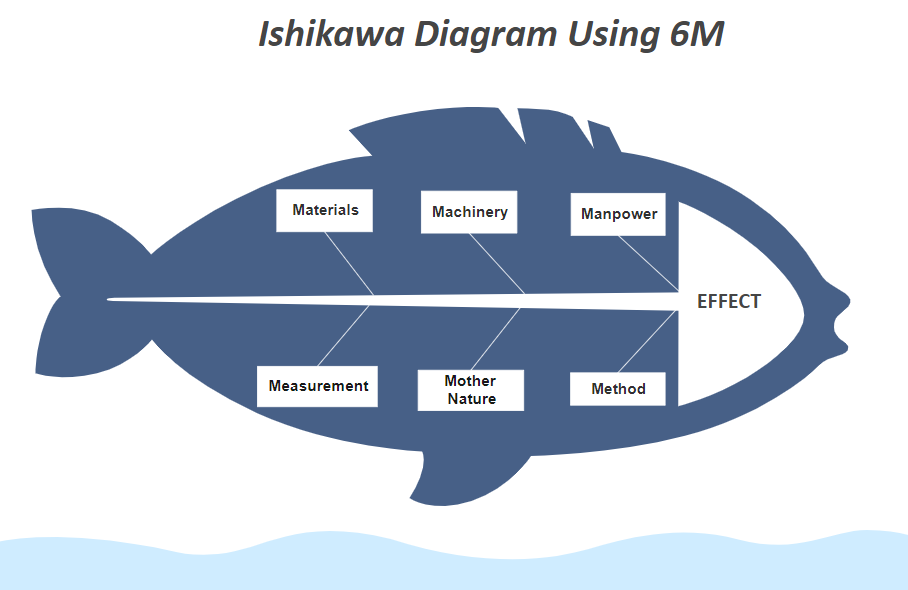
Fishbone Diagram Example 2
This is another fishbone diagram example. It has six elements respectively in six branches, which are Man, Machine, Material, Method, Measurement, Mother Nature.
Part 6: Conclusion
According to this article, there are mainly five parts to illustrate what is fishbone diagram, to tell you why a fishbone diagram is important, to tell you how to make a fishbone diagram easily, to give you some tips about how to make a fishbone diagram, and to show you some fishbone diagram examples.
EdrawMax is an easiest all-in-one diagramming tool, you can create fishbone diagrams and any other type diagrams with ease! With ready-made fishbone diagram symbols and cliparts, making fishbone diagrams could be as simple as possible. Also, it supports to export your work in multiple formats and share your work with others. Get started to create your fishbone diagrams now!

An all-in-one platform for 210+ diagrams.
・ Simple alternative to Visio
・ 26k+ symbols
・ 10K+ free templates
・ 10+ AI diagram generators


Related Articles:
Using Fishbone Diagrams for Cause Analysis


