Fishbone Diagram Examples & Templates
Edraw Content Team
Do You Want to Make Your Fishbone Diagram?
EdrawMax specializes in diagramming and visualizing. Learn from this article to know everything about fishbone diagram examples and templates, and how to use them. Just try it free now!
Fishbone diagrams can be used as a tool to help a team visualize a complex problem and generate ideas for solutions. It helps you understand the problem by looking at it from several different perspectives. In a fishbone diagram, you draw lines between the different parts of the problem and then draw the root cause.
Fish diagram templates will be helpful in the design industry for representing various types of business data using an eye-catching diagram. EdrawMax is a handy tool that can be used for creating a fishbone diagram. We can use EdrawMax's smart objects to draw, edit, arrange and connect various elements, such as shapes, lines, text, images, colors, styles, etc.
1. What is a Fishbone Diagram?
The Fishbone diagram is a cause-and-effect diagram that helps a team anticipate the consequences with an effect analysis by visualizing all the probable causes of a problem. It is also known as Ishikawa Diagram (named after its inventor, Japanese quality control expert Kaoru Ishikawa) or cause-and-effect diagram is also known as a cause-and-effect brainstorming method.
2. Free Fishbone Diagram Examples & Templates
A Fishbone diagram is an effective tool for analyzing problems by breaking them down into parts that can be traced back to their source and reworked until the original problem is solved. Edraw provides you many fishbone diagram templates, you can click to download and use them for free!
While The eddx file need to be opened in EdrawMax. If you don’t have EdrawMax yet, you could download EdrawMax for free!
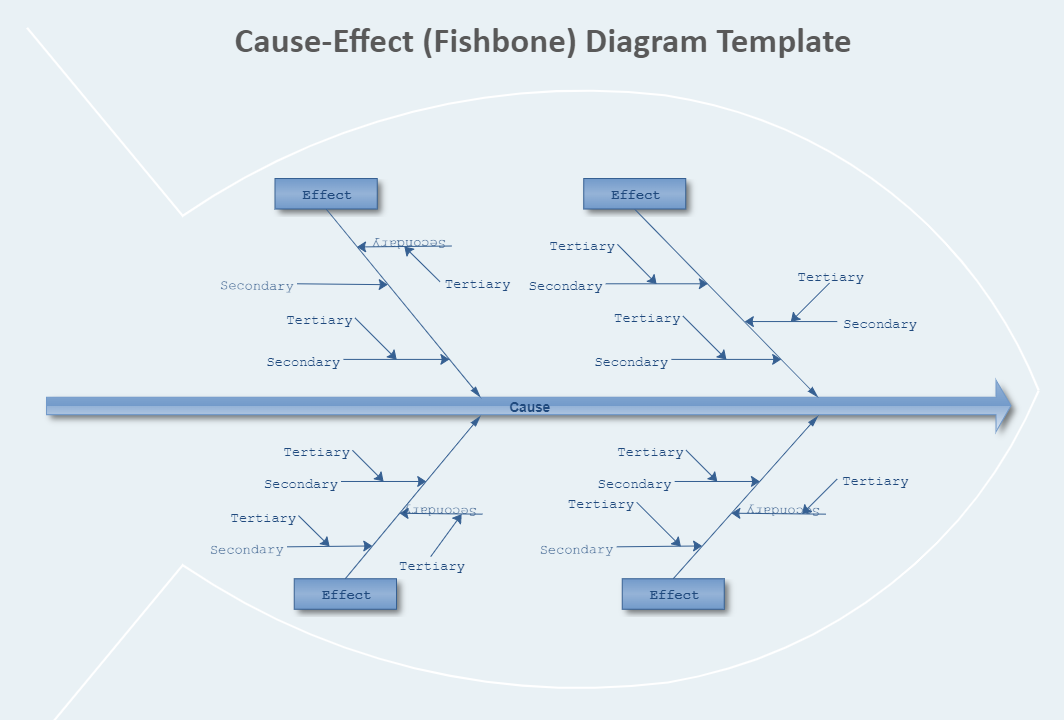
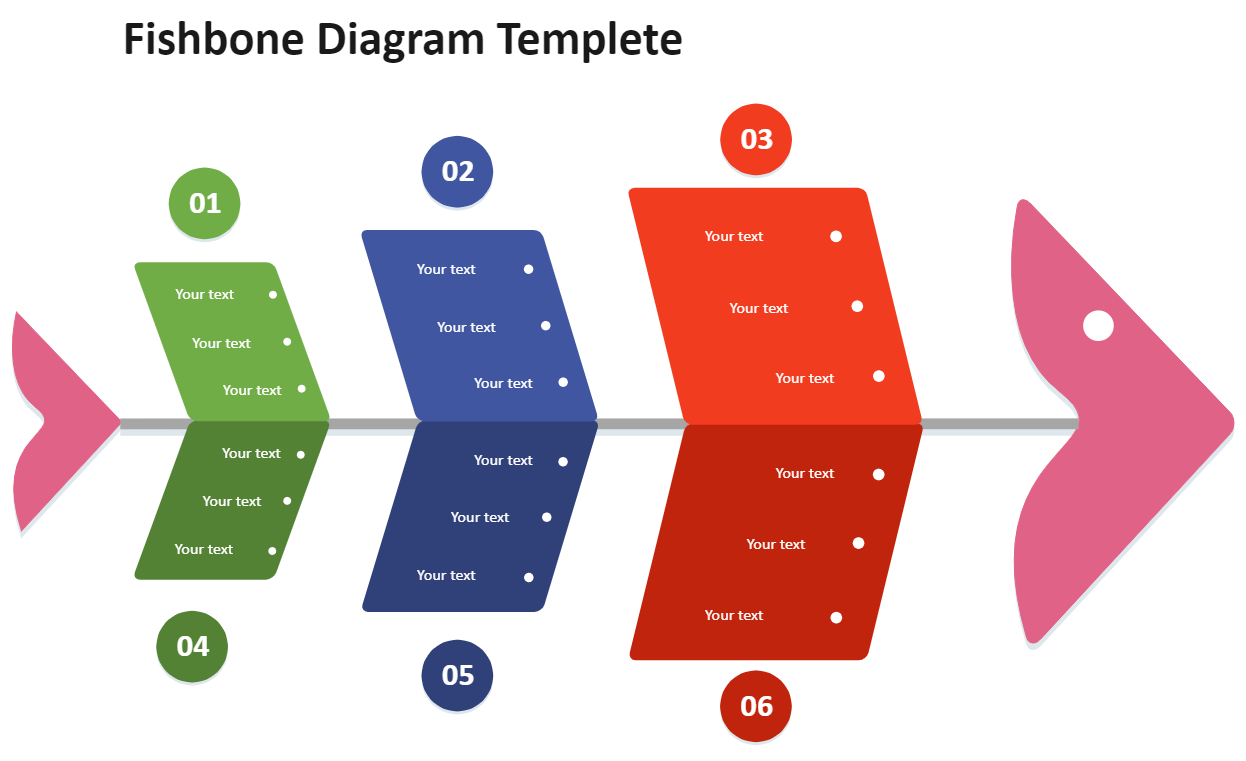
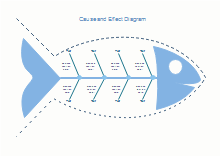
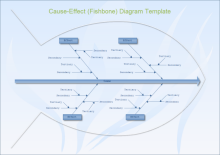
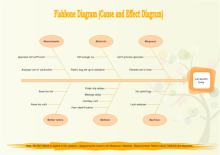
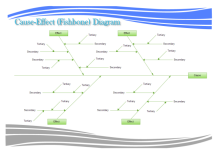
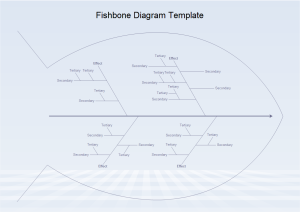
Example 1: Fishbone Diagram Template
There is a simple fishbone diagram template, and you can use it to create your own one!
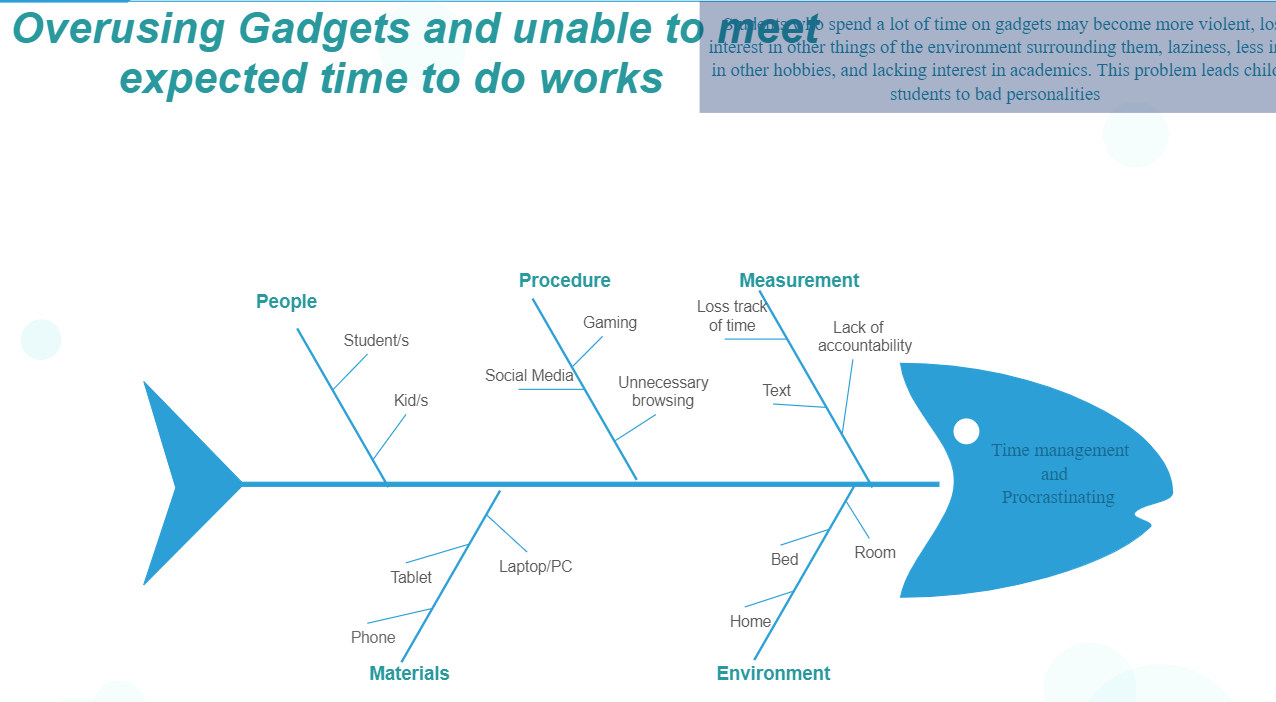
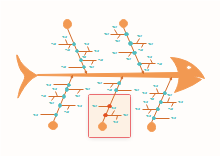
Example 2: Fishbone Diagram for Time-management
In this case, we will discuss the effects of the students' use of cell phones. As you know, nowadays everyone is obsessed with gadgets. Some people even forget their parents. The diagram above represents a student who spends too much time on gadgets such as phones, computers, video games, etc. The student who is too dependent on technology tends to become a social outcast.
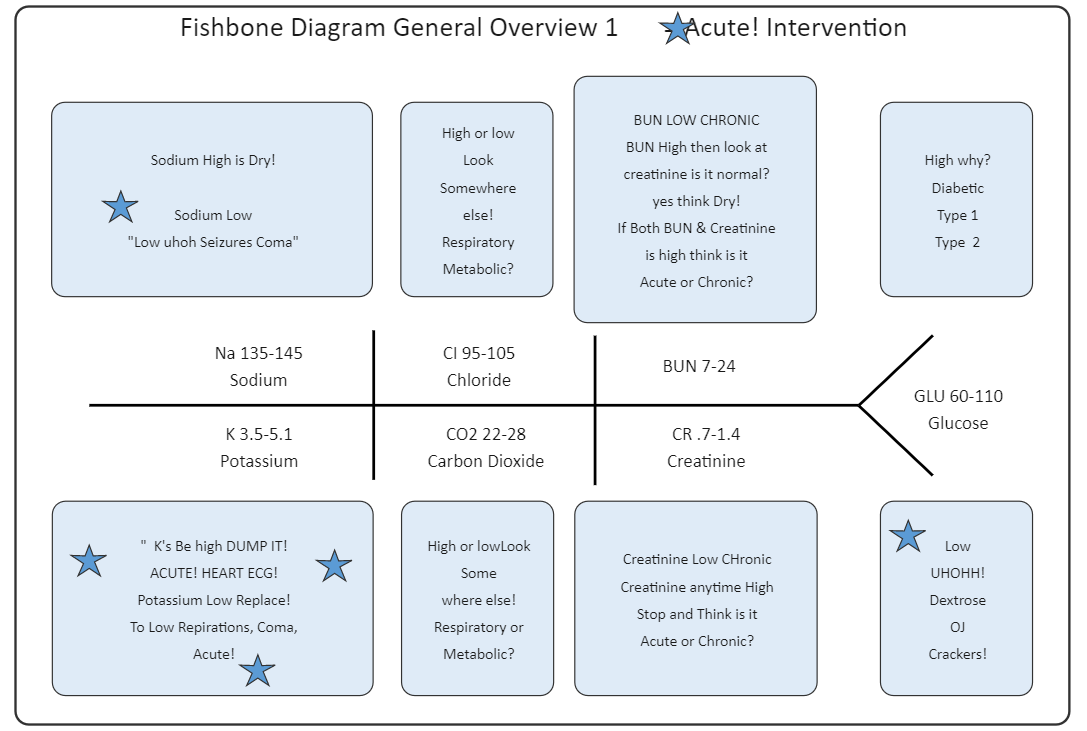
Example 3: Fishbone Diagram for Electrolytes
A Probability fishbone diagram shows how we can find the probability of two different events happening simultaneously.
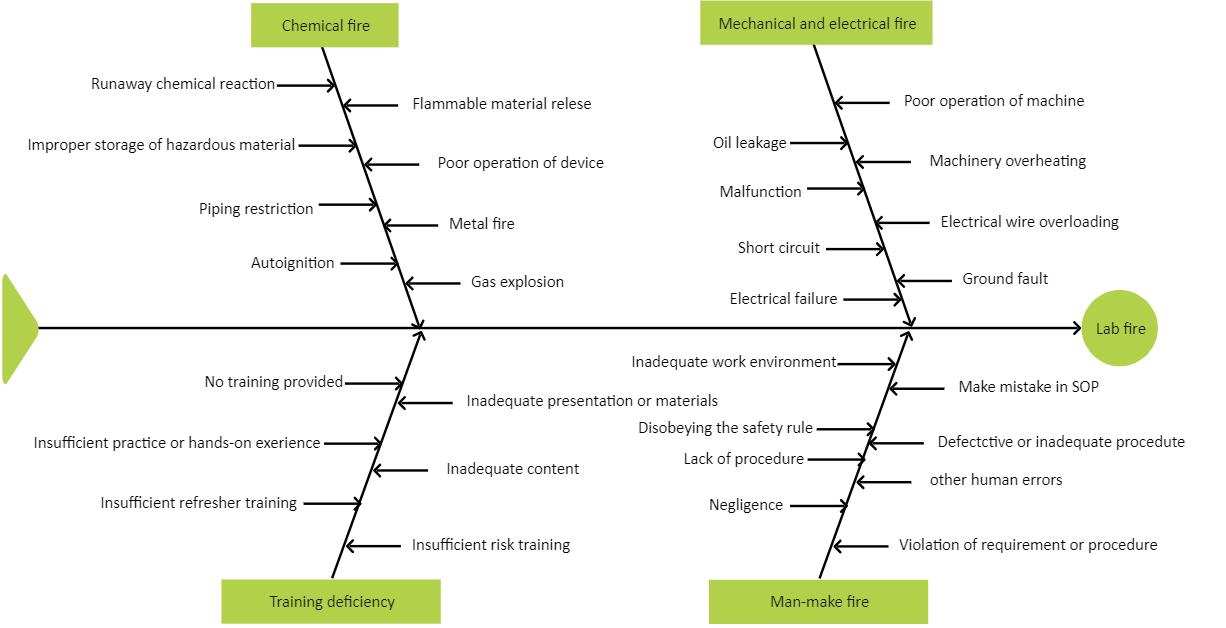
Example 4: Fishbone Diagram for Labs
When you compare products side by side, a fishbone diagram can help you determine whether you should buy both or just one. It lets you decide which aspect of each product matters more. In this example, you'll compare a dog grooming tool and a dog food supplement.
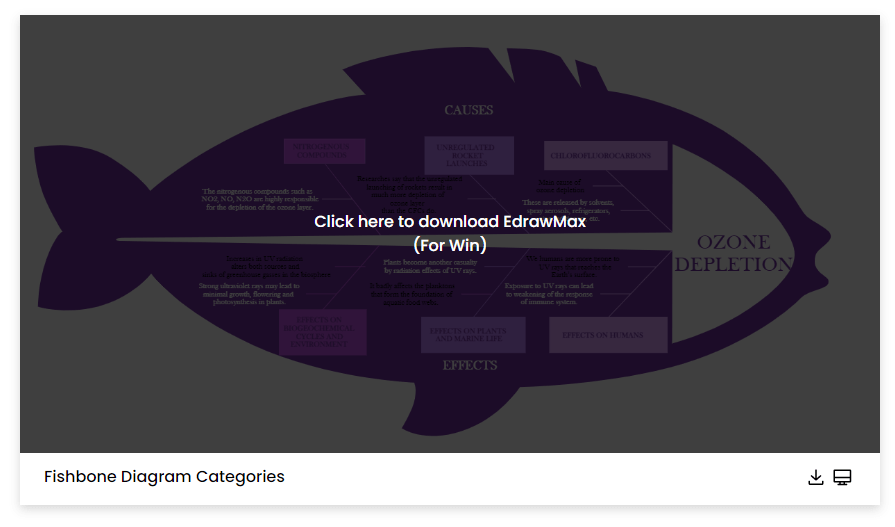
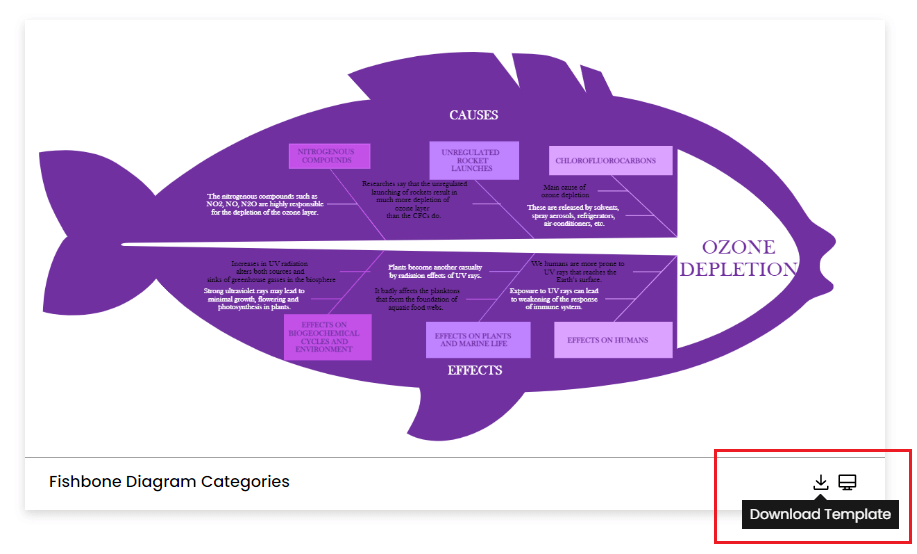
Example 5: Fishbone Diagram Categories
A fishbone diagram is an interesting way to look at your current job situation. It allows you to take a look at what you like about your current job, what parts of it you don't like, and what parts you want to change. It can help you create a more balanced work environment.
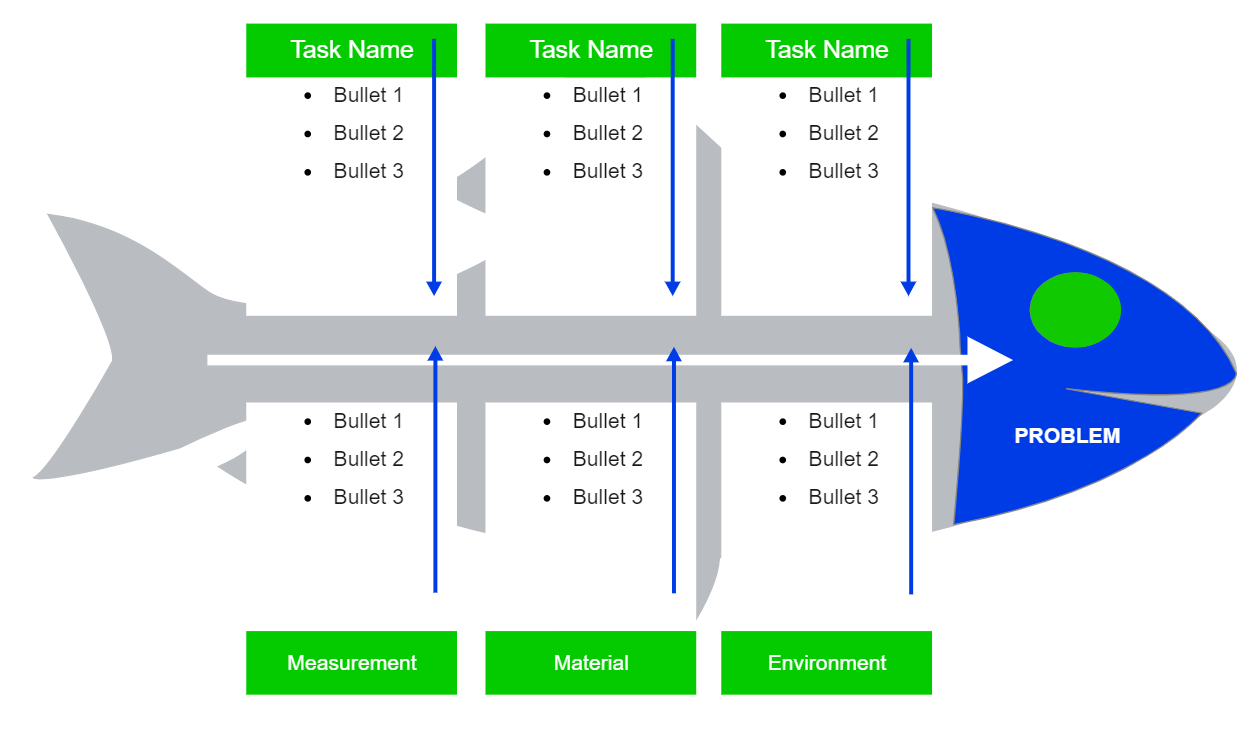
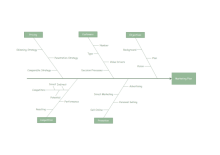
Example 6: Fillable Fishbone Diagram
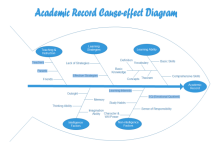
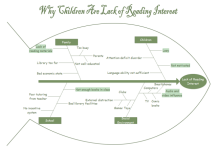
The fishbone diagram below describes several things in education:
- It helps us understand the differences between different types of learning.
- It helps us see the similarities between different types of learning.
- It can help us to compare different methods of teaching and learning.
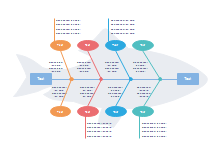
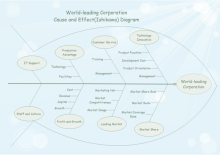
Example 7: Fishbone Diagram Categories
This fishbone diagram is most beneficial to our audience who need something to help them reach their productivity goals. Our values are that our customers should be happy and they must be effective and efficient. Finally, our market niche serves people who value time management and productivity. This combination results in us serving a niche that wants to solve a problem.
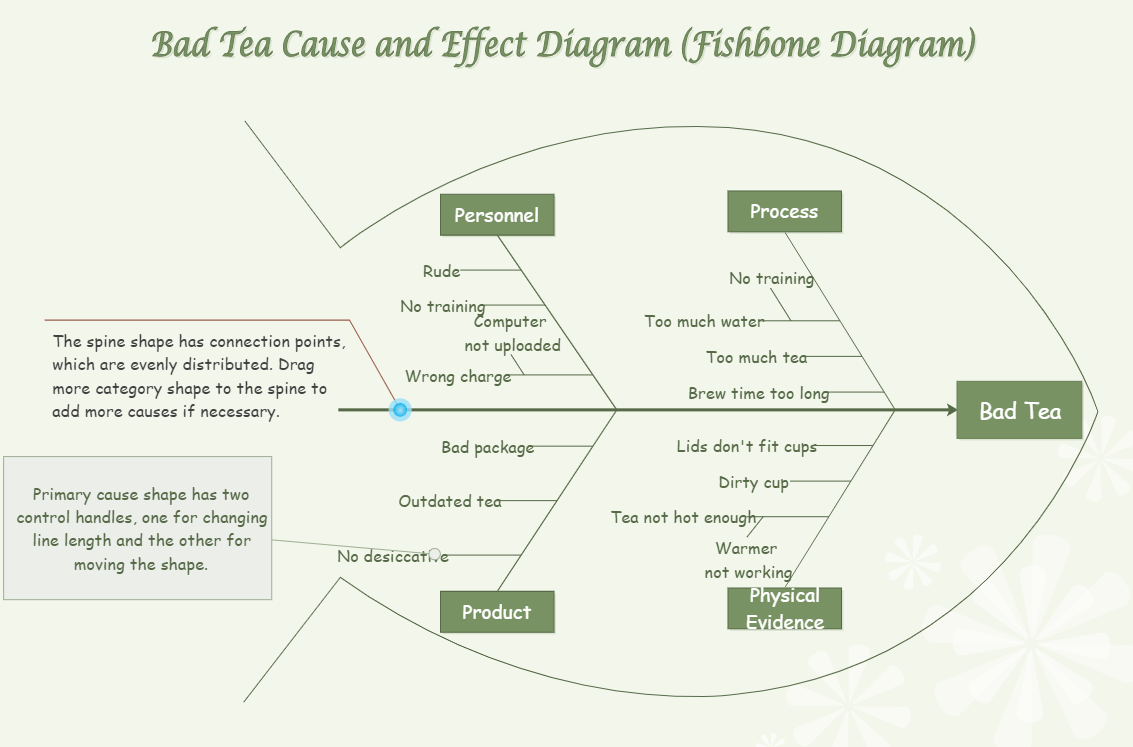
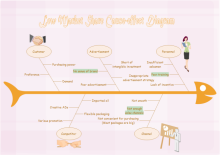
Example 8: Fishbone Diagram for Tea
Fishbone Diagrams are used to analyze the causes and effects of issues like food poisoning or an unwanted effect. A Fishbone Diagram can show a situation where people can quickly identify and understand the root cause of the issue. EdrawMax's Fishbone Diagram can be used to display the potential causes, as well as the effects of a problem. Using the online tool, you can see the process, physical evidence, and description of the product that can help you understand the gravity of the situation if a product has exceeded its expiration date.
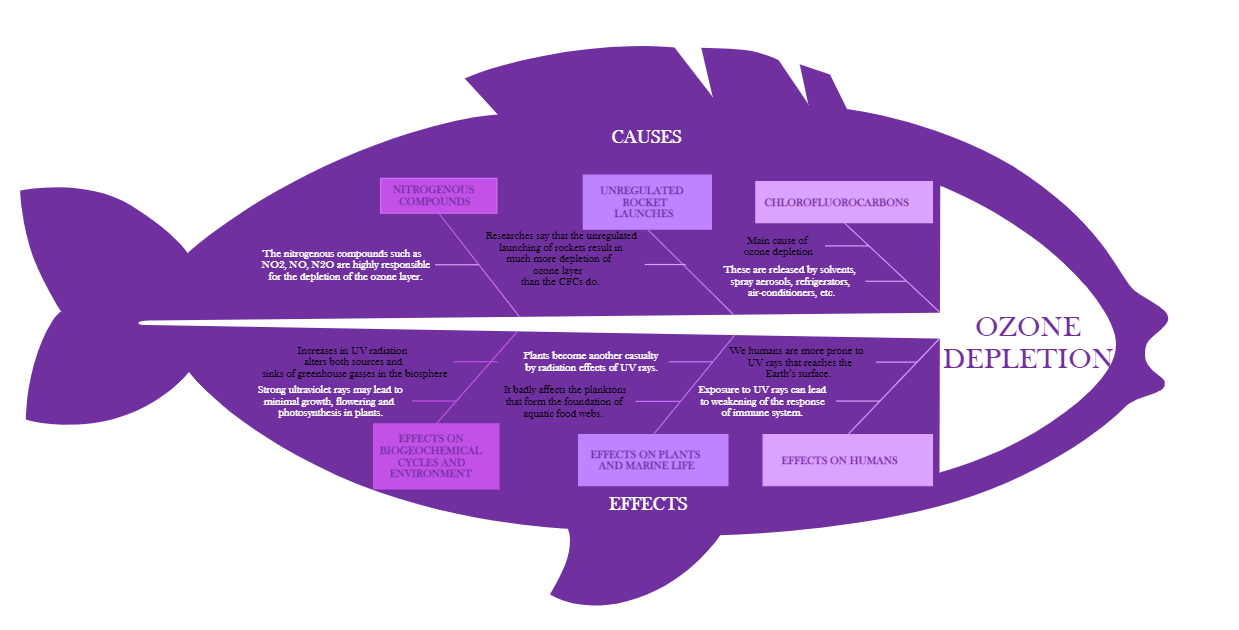
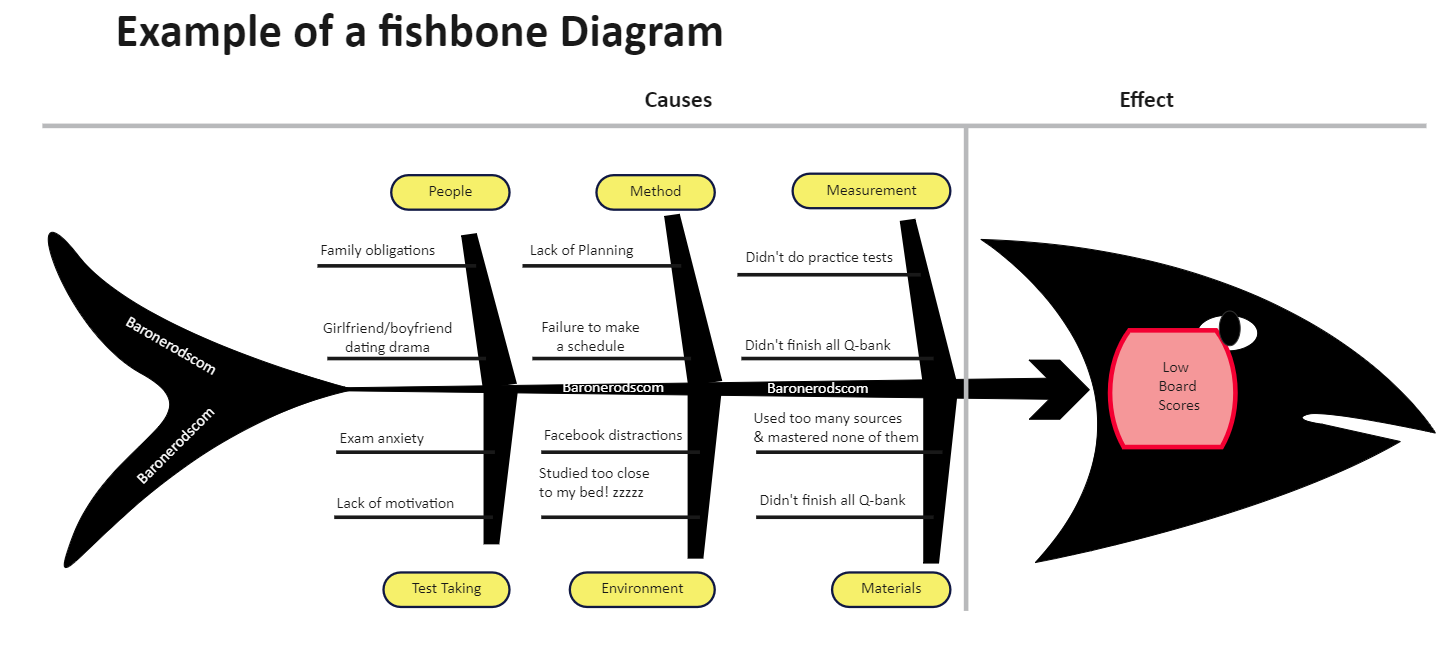
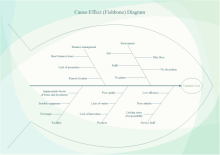
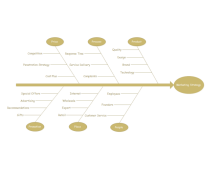
Example 9: Fishbone Diagram Example
This Fishbone Diagram Example is a modern quality management tool that explains the cause and effect relationship for any quality problem that has occurred or may occur. It provides a visual representation of all possible causes of pain, allowing you to analyze and determine the root cause. It is a tool that can be used proactively as well as reactively. This Fishbone Diagram Example gets its name from the shape it takes when it is formed. Its structure is similar to that of fish bones. The problem is written on the right side of the fish's head. Its spine is on the left, with bone-like arrows pointing to the leading causes.
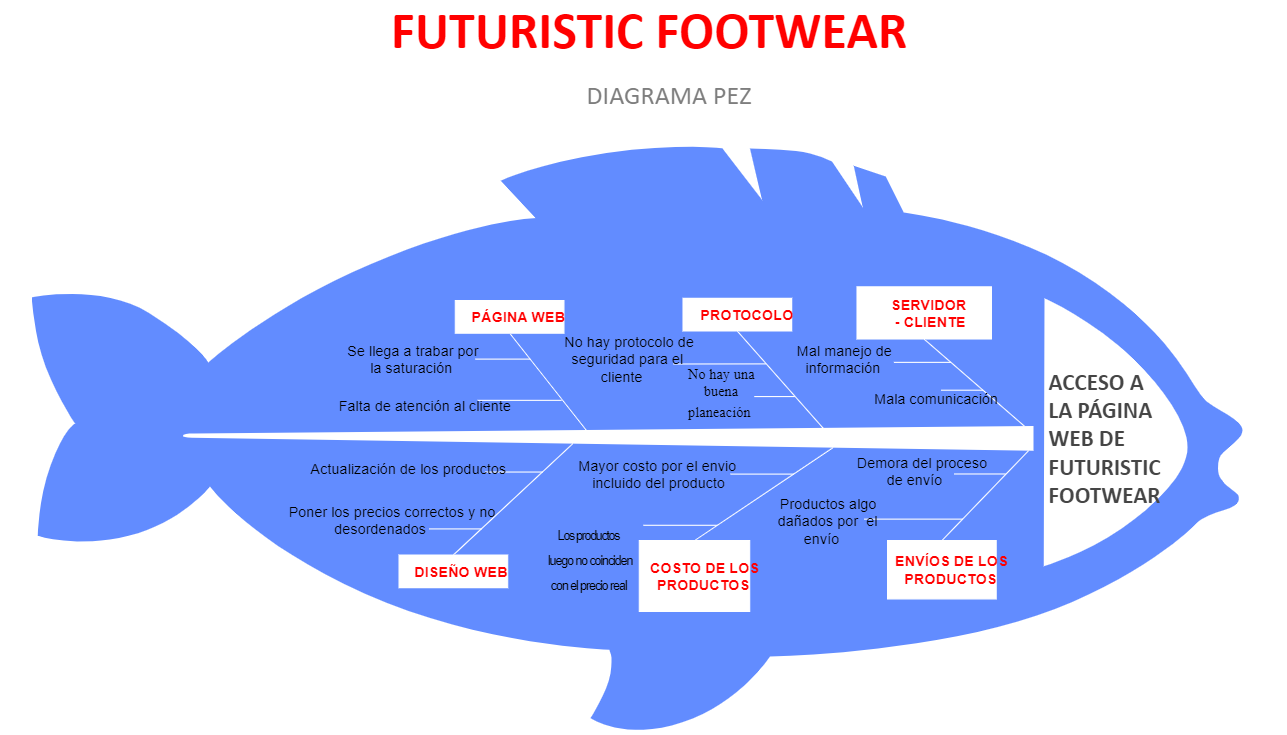
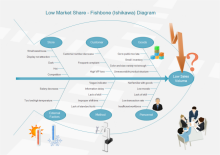
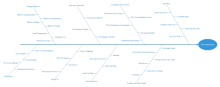
Example 10: Footwear Website Fishbone Diagram
A fishbone diagram is one tool to determine the causes and effects of various deviations, failures, or defects in the business. Business managers mostly use the Ishikawa diagram or the cause and effect diagram as a tool in finding out the deviations that are necessary to detect for business expansion. Learn more details from this diagram, or try to make yours with ease.

An all-in-one platform for 210+ diagrams.
・ Simple alternative to Visio
・ 26k+ symbols
・ 10K+ free templates
・ 10+ AI diagram generators


|
|
|
| Node Fishbone Diagram | Outline Cause and Effect Diagram | Highlight Fishbone Diagram |
|
|

|
| Fishbone Diagram Presentation | Icon Fishbone Diagram | Healthy Life Fishbone |
|
|
|
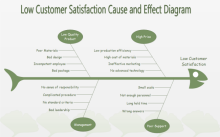
| Cause and Effect Diagram | Sales Decrease Ishikawa Diagram | Low Satisfaction Fishbone |
|
|
|
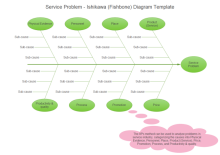
| Fishbone Diagram | Service Problem Ishikawa Diagram | Market Cause Effect Diagram |
|
|
|
| Customer Loss Fishbone Diagram | Result Delay Fishbone | Academic Record Fishbone |
|
|
|
| Marketing Strategy Fishbone | Time Management Fishbone | Cause Effect Line Style |
|
|
|
| Reading Interest Fishbone | Ishikawa Diagram | Force Field Analysis Diagram |
Fishbone Diagram Templates for MS Office
Start From Free Fishbone Diagram Template. EdrawMax offers the easiest way to create a fishbone diagram. It only takes a few seconds to choose a fishbone template, edit text, and add the finishing touches. To find a ready-made template, go to the fishbone diagram templates page and choose one that best fits your requirements.
You can click the table of contents below to get the related templates.
3. The Usage and Benefits of Fishbone Diagram
Now you know what a fishbone diagram is and viewing the examples, here are some of its benefits:
- Help the teamwork on root causes rather than secondary causes by ensuring you avoid focusing on symptoms and start analyzing the causes.
- With this diagram, a team can easily and efficiently work on the causes together rather than independently.
- A fishbone diagram is an ideal tool that helps a team create a prompt for brainstorming all possible ideas.
- Besides determining, analyzing, and prioritizing root causes, this diagram also helps analyze all other potential causes.
The Usage of Fishbone Diagram
1, Manufacturing: When using a fishbone diagram for manufacturing, knowing the analysis's effect or outcome is essential before adding effect to the diagram. After creating the spine of your diagram, you will need to give it bones in the form of causes. The bones will be categorized into six causes which represent the 6 Ms of manufacturing in your preferred order. These 6 Ms of manufacturing are globally recognized standards, and they include:
- Method
- Measurement
- Manpower
- Machine
- Mother nature or Milieu
- Material
One thing to note is that some industries may have extra Ms that should be inclusive, and for that, you will have to expand it to allow those inclusions.
2, Marketing: Fishbone diagrams also play a major role in the marketing processes in the industry. This diagram offers an effective method to visualize all ideas since marketing is a difficult aspect to gauge. And so with marketing diagram, you will have to include the 7 Ps of marketing, which includes:
- Processes
- Product
- Physical evidence
- Price
- Place
- Promotion
- People
3, Sales Process: One thing to keep in mind is that a sales fishbone diagram should always contain the 5 Ss of sales. The 5 Ss of sales are very effective and helpful aspects in analyzing sales of a specific industry. The five branches consist of:
- Samples
- Schemes
- Synchronous
- Skin
- Search
4, Ishikawa Diagram for Presentations: Ishikawa diagram is a helpful and effective tool when presenting specific issues and solutions to your team. With it, you can use it to present a particular outcome and the better ways to attain it, discover solutions, or deconstruct an issue.
5, Cause and Effect Diagram: A Cause-and-Effect fishbone diagram is another useful diagram. With it, you can use it across any industry, meaning it can also fit several other uses apart from manufacturing, sales, and marketing alone.
Cause and effect analysis gives you a useful way to solve the problem entirely by generating all potential causes and categorizing them in an orderly way. When you use the fishbone analysis, you first brainstorm all of the factors contributing to this problem. Once you've identified all possible causes of the problem, you can do a much more thorough review to find the actual root cause. With the root cause known, you can move forward and solve almost any problem.
How to Use the Fishbone Diagram
a) Define the problem statement
The first step always is about identifying the problem to know how to use the fishbone diagram. And for this part, you have to come up with a detailed statement describing what the problem is and how and when it occurs. After defining and explaining it, write that problem on the diagram's left or right side, as the fish's "head," and draw a horizontal line just below it.
Note: Before exploring causes, ensure the team has agreed on the problem definition.
b) Identify the major factors involved.
What factors are part of the problem? In this step, you will have to identify factors involved, which may include external forces, systems, materials or people, and equipment involved with the problem. After that, you can draw the line off the diagram's spine and draw out those factors while brainstorming the situation's effects.
Note: The number of categories should be kept below ten.
c) List out the causes
Once you have factors involved or categories defined, you can start listing each bucket's causes. These will represent the bones used to analyze the main problem (represented by the spine). Using fewer words, write the causes in shorter lines.
Tips for using the fishbone diagram
To fully benefit from using a fishbone diagram, you need to consider the following tips:
- Communicate the Objective
- Show a Fishbone Diagram Example
- Include the Potential Causes
- Highlighting and Explaining Potential Causes
- Manage Time
Defining the objective of a meeting before a team meeting is a first and principal step. The process of reviewing the meeting objectives is essential because it ensures every member of the team comes in prepared. So, always ensure you have communicated about the objective of the meeting prior.
A well-elaborated example of a fishbone diagram that everyone can understand should be shown right at the beginning of the meeting. Having something that everyone can relate to will help them understand "how the process can go about."
This step aims to generate a concrete list of potential reasons, which will may rely on brainstorming. This process will be done as a team and without debating and criticizing any raised idea.
You will have to ask your member to write down their ideas on potential causes for this part. It would be best to use sticky notes since it will be easier for any team member to share their thoughts. After they are done writing, they should stick on the whiteboard and briefly explain their ideas.
Proper time management will ensure that all potential causes are discussed. And to ensure this, you will have to allocate and divide time accordingly.
4. How to Use Fishbone Diagram Templates
EdrawMax is vector-based software that provides various templates for your fishbone diagram. It provides an easily understandable interface for its users to draw efficiently and helps users edit existing templates and layouts and make their designs or template. It also provides 26000+ symbols to illustrate your fishbone diagram. You can learn how to make fishbone diagram in details from this fishbone diagram guide.
There is the method of using fishbone diagram templates to design a perfect layout. The first method lets you develop a fishbone diagram after downloading the template and the EdrawMax diagramming software on your computer. Following is the guide for the first method on how to use fishbone diagram templates.
Step1 Install EdrawMax
You can edit the templates directly from this page. First of all, when your mouse click to the templates on this page, you can download the EdrawMax easily, or you can download EdrawMax here.
Step2 Download the Template
After installing EdrawMax, you can go and download the template by clicking on the bottom right corner or look for a template in the EdrawMax library without going online in desktop.
Step3 Open the Template
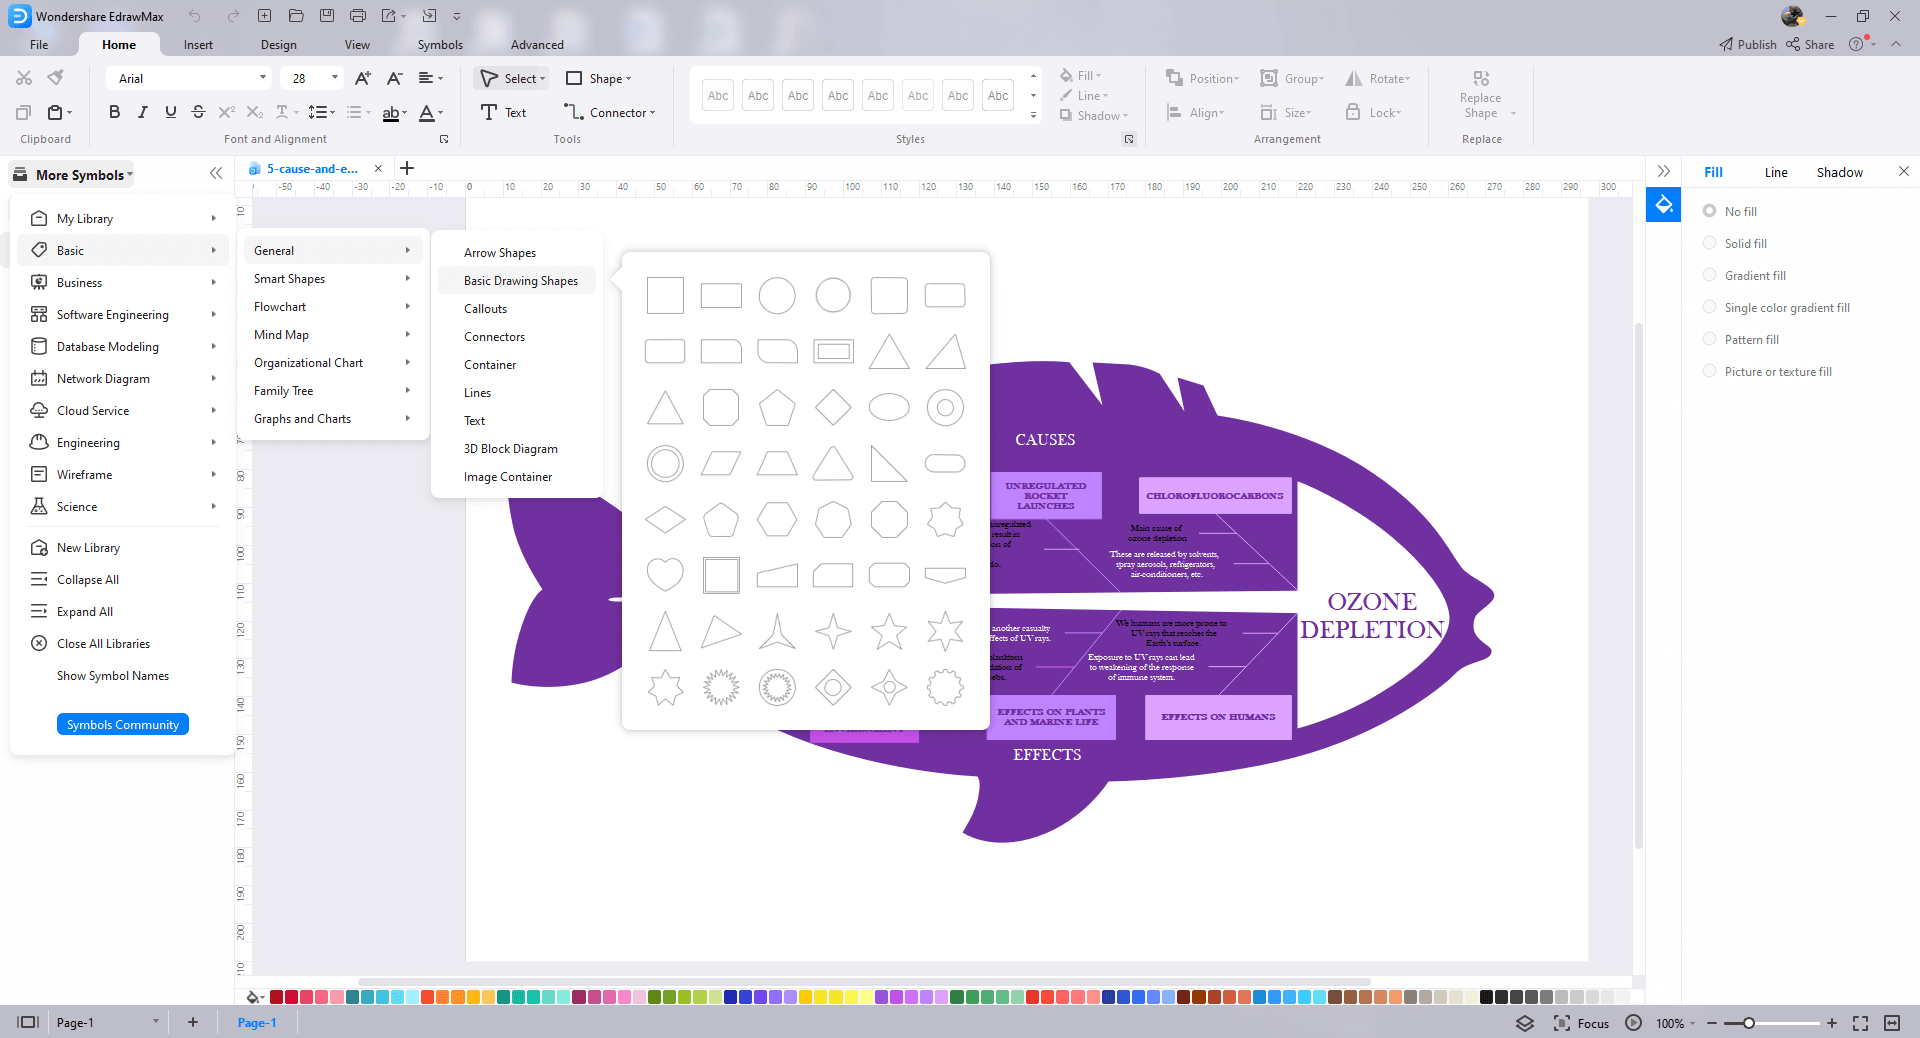
After downloading the template, you can double click to open it in EdrawMax diagramming software, or you can open EdrawMax beforehand and navigate to the template to open it. Every fishbone diagram diagram is incomplete without symbols. Head to the 'Symbols' section and click on the 'fishbone diagram ' and 'Fishbone Diagram' to import important symbols.
Step4 Customize the Fishbone Diagram Template
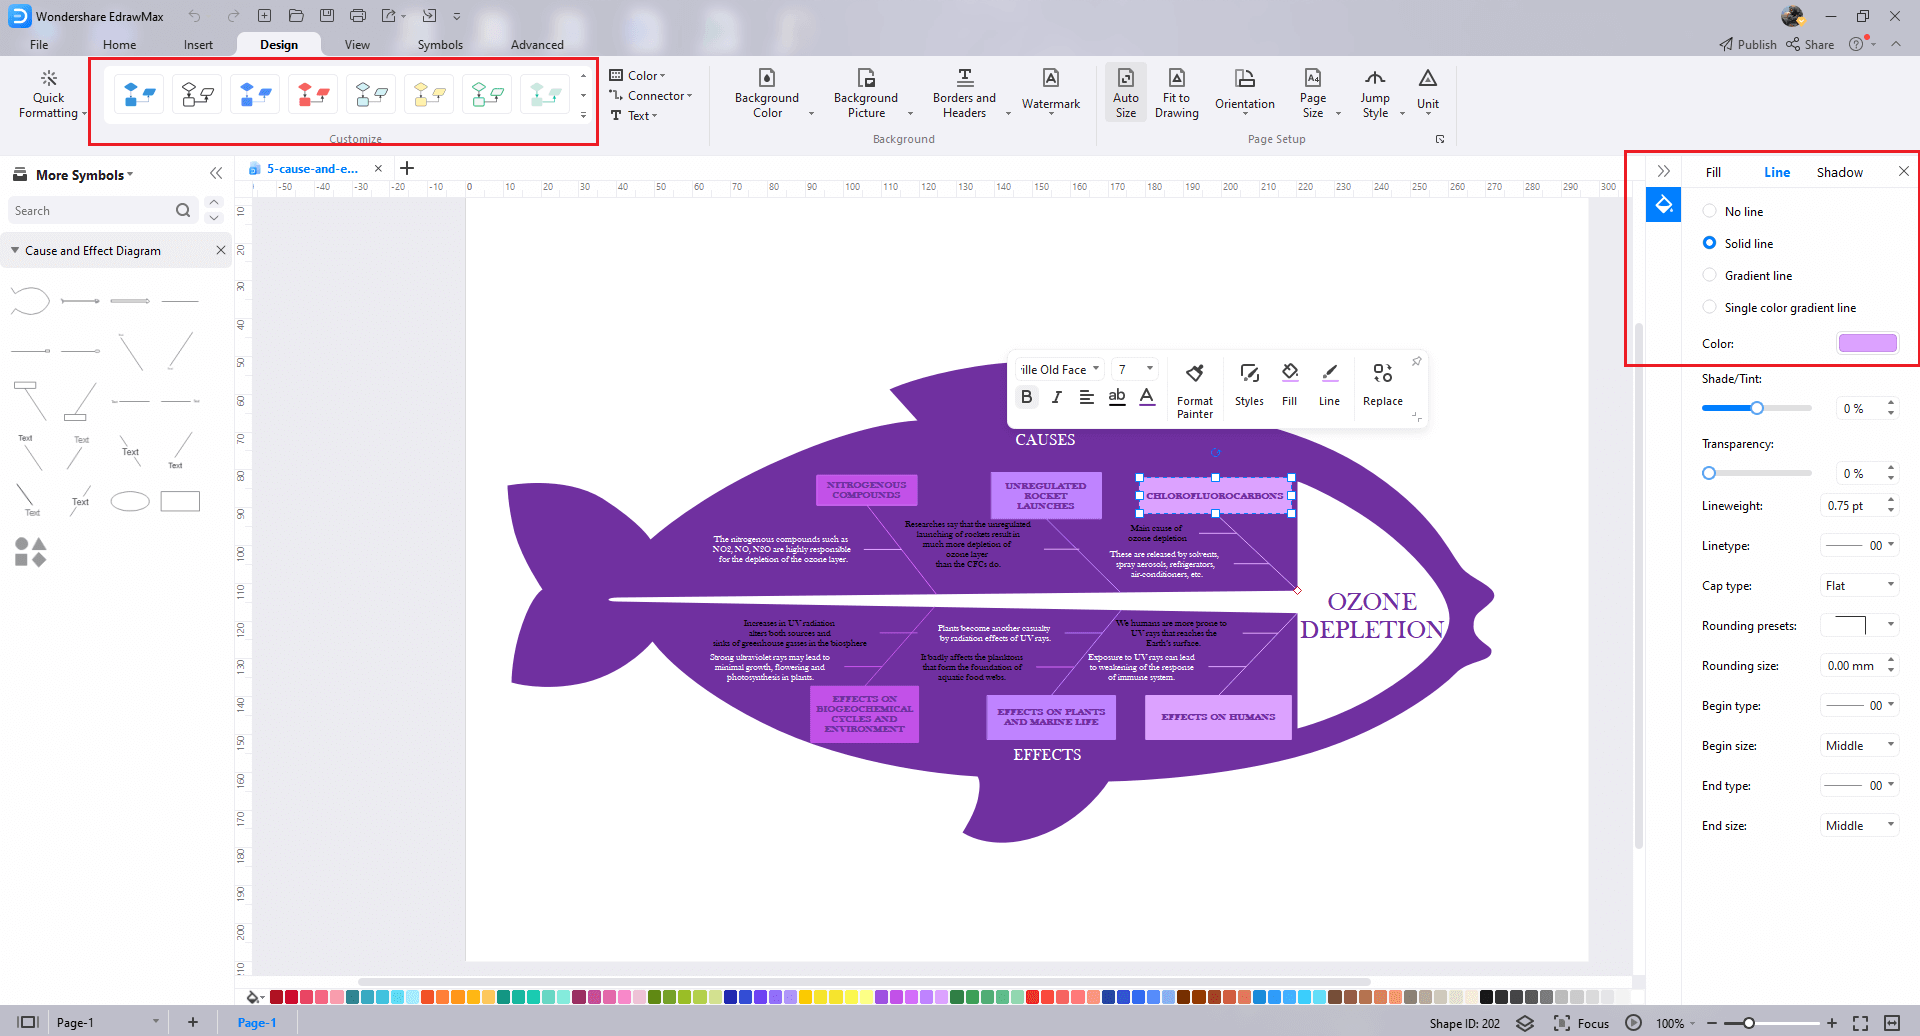
After opening it, the next step is to customize and edit the fishbone diagram template. EdrawMax gives you various unique diagramming tools that help you edit the template any way you want. You can change the color and the font liner of the template. You can edit the layout and include the list of requirements, measure dimensions, and render features using fishbone diagram symbols from the EdrawMax symbol library. EdrawMax features a comprehensive library with 26000+ professional symbols that you can use for free with an easy drag and drop.
Step5 Save or Export
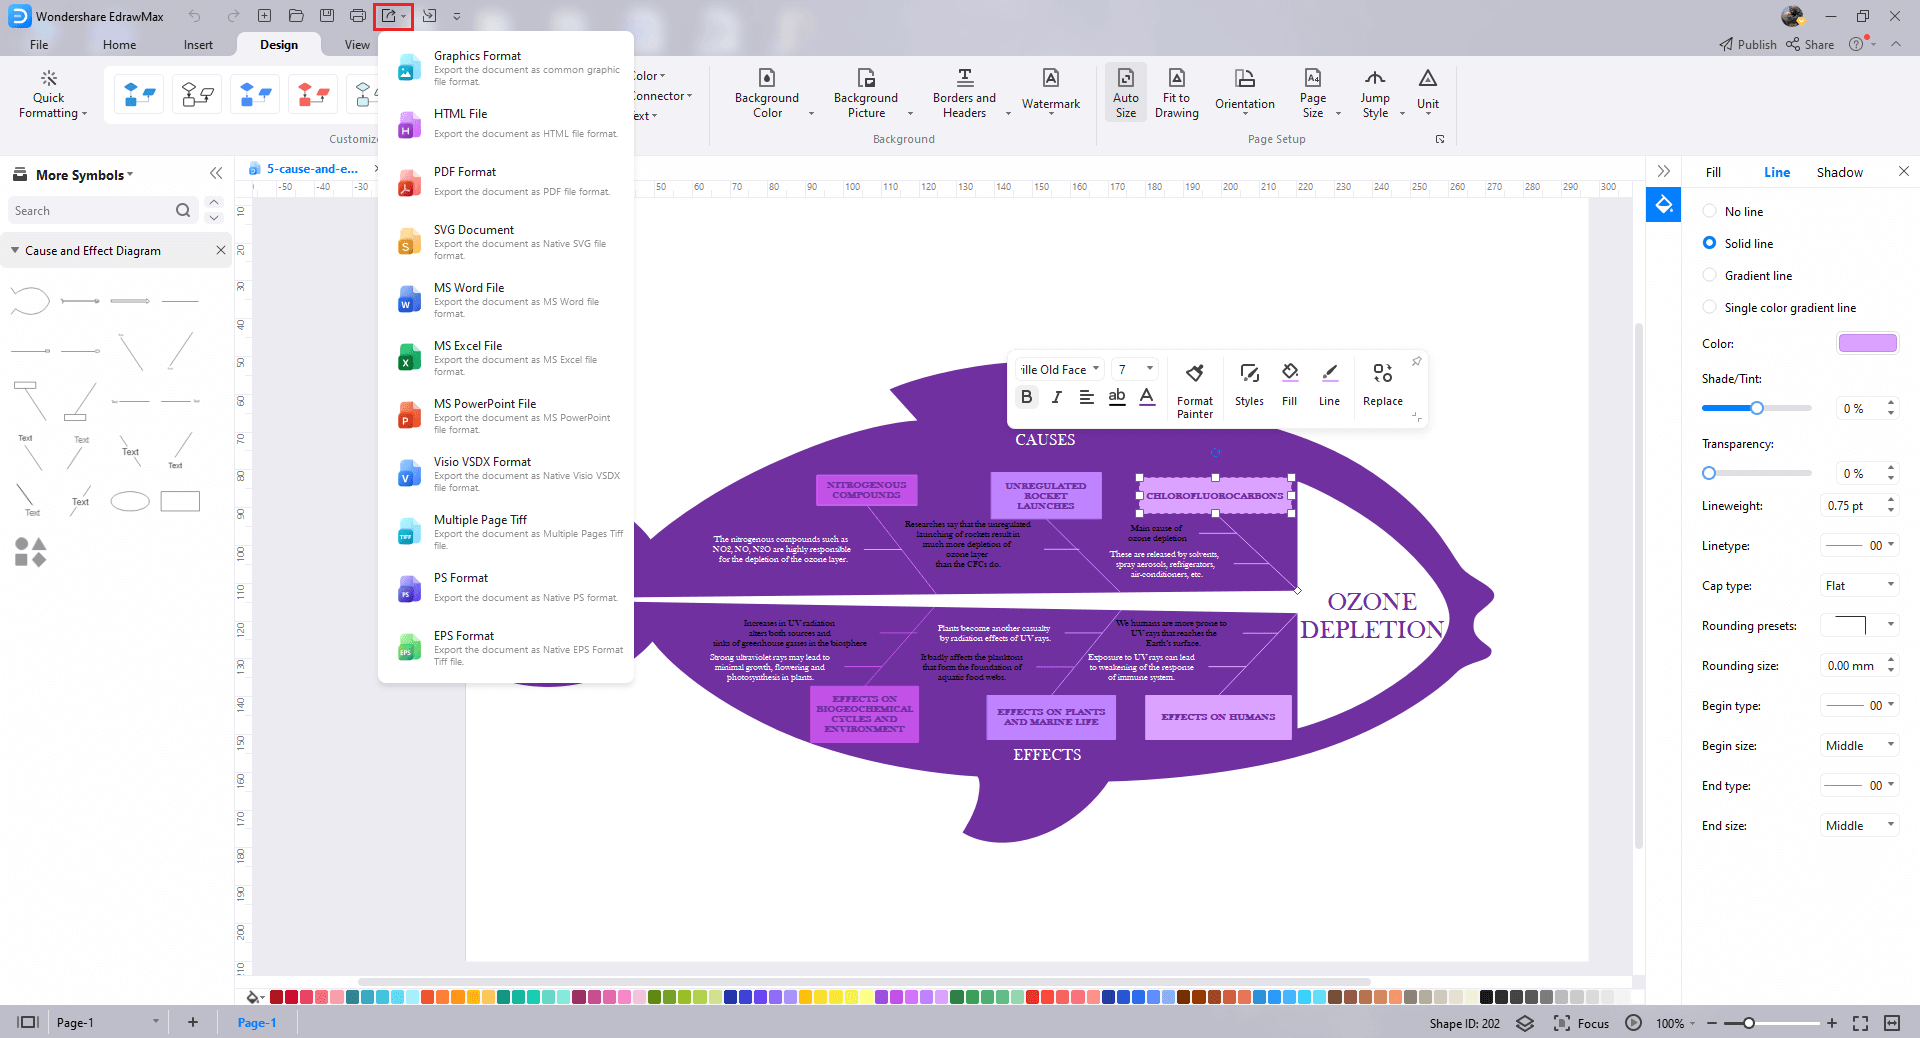
After you customize the fishbone diagram template and complete your fishbone diagram, the next step is to save or export your drawing. EdrawMax supports various document formats, which means you can export your drawing in any format you want, such as Microsoft Office, pdf, graphics, HTML, Visio, and many others. Export your drawing by going to the 'File' option in the top menu bar and clicking on 'export'. After that, select the document format and click 'ok'. You can also share your drawing on social media or print it directly from EdrawMax. EdrawMax also gives you a presentation mode that you can use to show your drawing to others or your team members.
5. Free Fishbone Diagram Software
EdrawMax is the best free fishbone diagram software that includes an extensive collection of free templates you can download and customize to fit your needs. How can it help yourself to develop a better strategy? For instance, EdrawMax can help you improve your competitive edge by making a fishbone diagram. You can draw with shapes, arrows, and lines. Just insert the elements of your diagrams and connect them. There is no limit on creating the number of diagrams you can create.
- EdrawMax offers easily editable templates with various options for displaying relationships and emotions.
- Professionals prefer EdrawMax because of its simple user interface and excellent team collaboration features.
- You can easily share the fishbone diagram with others using the built-in option.
- Its user-friendly dashboard and simple drag-and-drop feature make it the best free fishbone diagram software for both beginners and professionals.
- It can export and import files into various formats, including MS Office, Graphics, PDF, HTML, Visio, and others.
- All of your fishbone diagrams are encrypted for maximum security. Hence, you do not have to be concerned about losing your data.
6. Final Thoughts
The fishbone diagram templates by EdrawMax are designed for both technical and non-technical people. It's very important to understand that these templates are just samples. So, it won't be like you are getting a full-fledged product from these templates. However, these are some of the best examples of the type of diagrams that you can expect to see in your projects.
The fishbone diagram is a simple yet very effective tool that improves a process and a commodity's quality. When an organization is persistent with implementing this visual representation of cause-and-effect relationships, it can be proactive in addressing its problems quickly and effectively. Download EdrawMax and edit any fishbone diagram template today and get started on finding a solution to your problem.

Fishbone Diagram Complete Guide
Check this complete guide to know everything about fishbone diagram, like fishbone diagram types, fishbone diagram symbols, and how to make a fishbone diagram.
You May Also Like
Genogram Examples & Templates
Examples


