Data Flow Diagram Symbols
Want to Draw Data Flow Diagrams with Ease? Try This On!
EdrawMax Data Flow Diagram Maker helps to create professional data flow diagrams for free with easy-to-edit templates and symbols. Give it a shot!
In this passage, you will learn what a data flow diagram is and get to know some typical symbols and notation. For someone who wants to draw a data flow diagram can use an easy-to-use diagram tool to achieve it, it also offers multiple DFD templates to edit. Don't miss it!
What is a Data Flow Diagram?
Every business has so many moving parts or several departments that tracking each aspect of their contribution could be a challenge. Continually figuring which processes or areas need improvement improves business efficiency and productivity at work. Data flow diagrams (DFD) are one of the most simple and effective tools for businesses to understand, perfect and implement new systems. DFD symbols are visual representations of an organization's process or system to make it easy to understand and prune.
The data flow diagram provides information about the process itself, outputs and inputs of each entity, and the various subprocesses the data moves through. Visualizing each element in the process makes it easy to identify inefficiencies and produce the best possible system.
Data flow diagrams originated from their use in operational research to model workflow in organizations. DFD emanated from the Activity Diagram used in Structured Analysis and Design Technique (SADT) at the end of the 1970s. Data flow diagrams quickly became a popular way to visualize the process data and steps. Although DFDs were mainly used to show data flow in computer systems, they quickly became useful in documenting significant data flows.
If you want to know how to create data flow diagram with a handy tool,a step-by-step video tutorial is ready for you. Watch this out!


Physical and Logical Data Flow Diagrams
Before you embark on creating a data flow diagram, it is important to determine what suits your needs between a physical and a logical DFD.
Physical DFD focuses on how things happen by specifying the files, software, hardware, and people involved in an information flow.
Logical DFD focuses on the transmitted information, entities receiving the information, the general processes that occur, etc. It describes the business activities but doesn't delve into the technical aspects of the process.
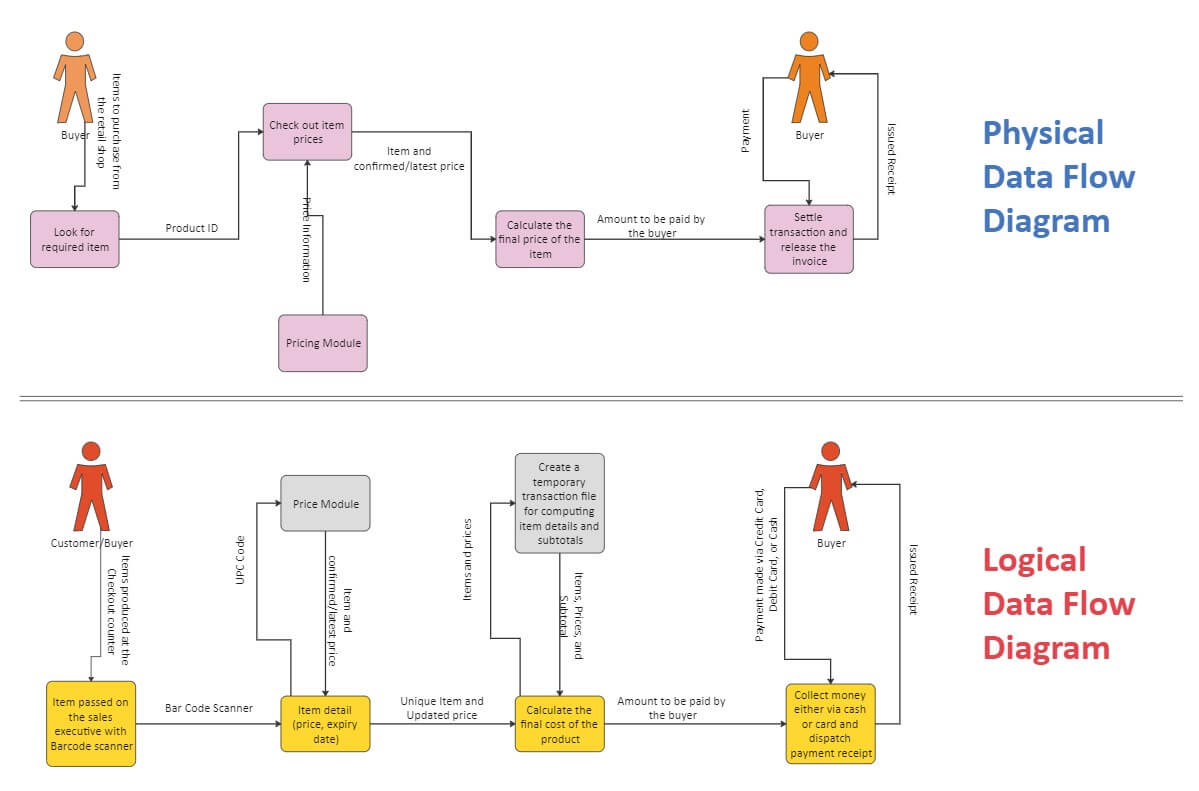
You might need both physical and logical data flow diagrams to describe the same information flow. When well-coordinated, they provide more details than each would independently.
EdrawMax
Efficient Data Flow Diagram Maker >>
- Superior file compatibility: Import and export drawings to various file formats, such as Visio
- Cross-platform supported (Windows, Mac, Linux, Web)
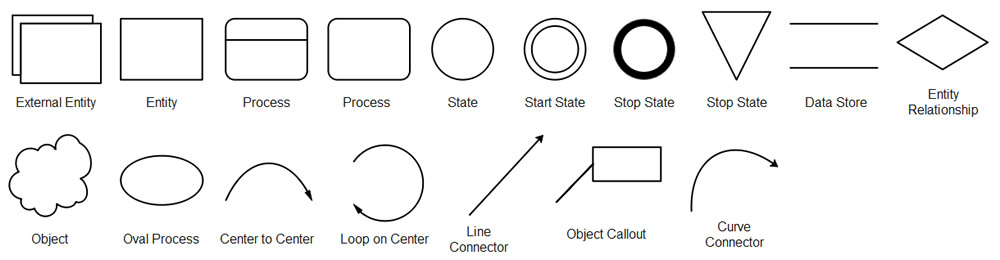
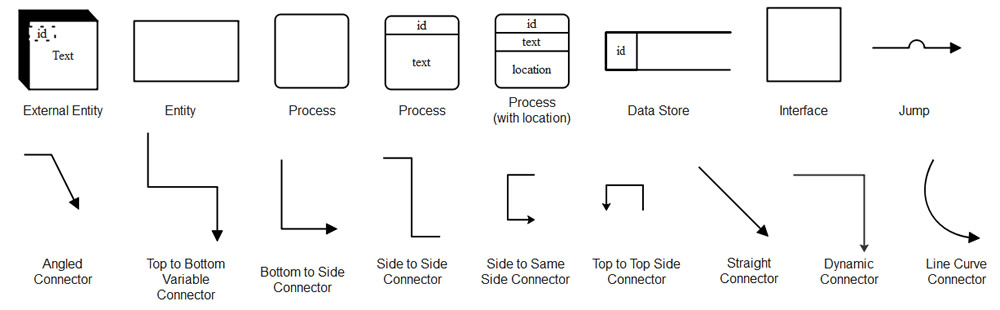
Data Flow Diagram Symbols and Notation
Data Flow Diagram Symbols
DFD symbols are consistent notations that depict a system or a process. It entails the use of short-text labels, arrows, circles and rectangles to describe data flow direction. Also forming part of DFDs are varied sub-processes, data storage points, and data inputs and outputs.
A data flow diagram has four basic elements. The elements include external entities, data stores, processes, and data flows. The elements are best represented by the two main methods of notation used in DFDs – Yourdon & Coad, and Gane & Sarson. DFD symbols vary slightly depending on methodology. Even so, the basic ideas remain the same.
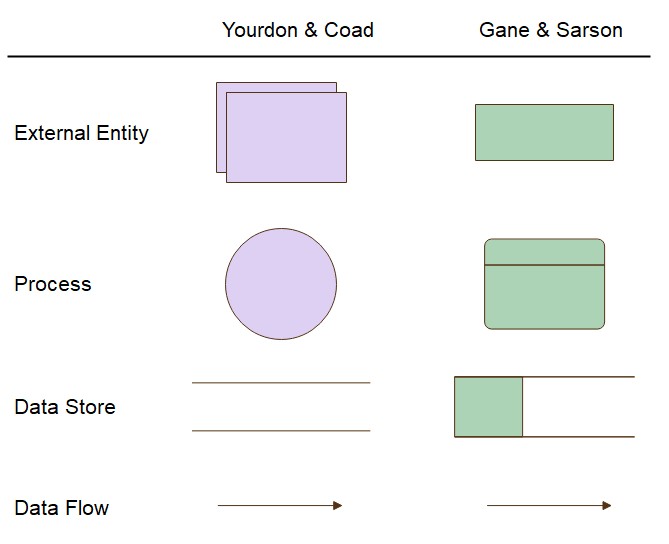
- External entities are represented by squares as the source or destination of data.
- Processes are represented by rectangles with rounded corners.
- Data Flows are referred to by arrows to denote the physical or electronic flow of data.
- Data Stores are physical or electronic-like XML files denoted by open-ended rectangles.
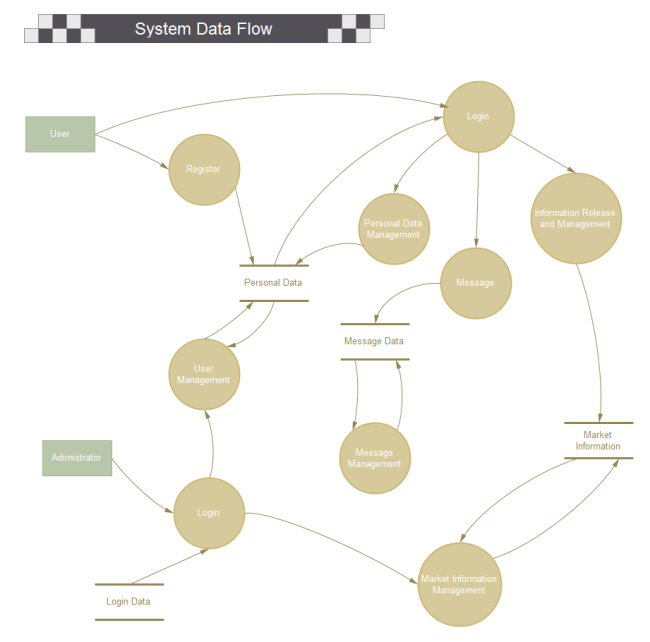
Data Flow Diagram
Data Flow Model Diagram
Yourdon and Coad
Download Data Flow Diagram Symbol Legend
Want to Create Data Flow Diagram with Pre-made Templates? Try Now!
EdrawMax Data Flow Diagram Maker offers different categories of templates in every industry, such as library management, hotel management, school, live shopping, etc... You can use pre-made templates to design your own diagram with ease! Do it now!
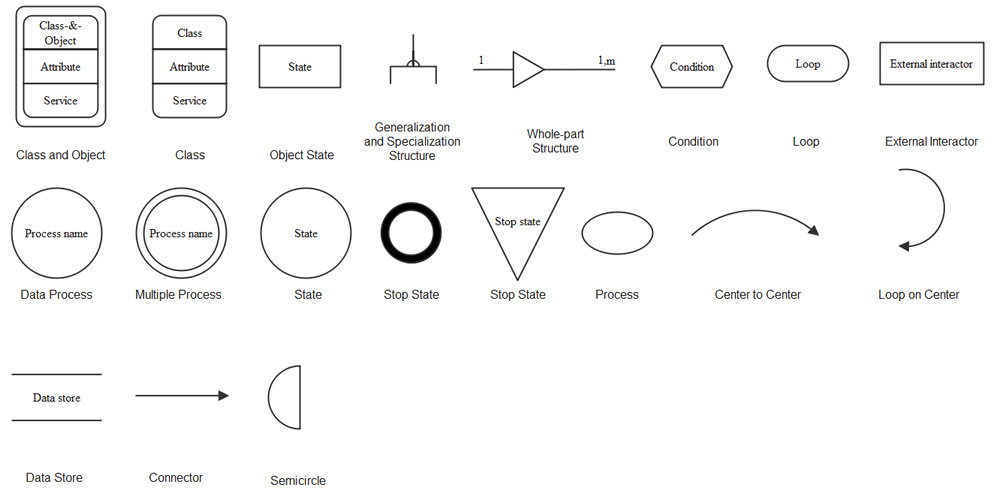
Data Flow Diagram Notations
External Entity - An outside process or system that sends or receives data to and from the diagrammed system. They are also known as sources, terminators, sinks or actors and are represented by squares.
Process - This procedure manipulates the data by changing or processing incoming data to an output. Processes (that mainly entail input-processing-output) are portrayed by rectangles with rounded corners, which contains 3 descriptive elements:
Firstly an identification number appears in the upper left-hand corner. This is allocated arbitrarily at the top level and serves as a unique reference.
Secondly, a location appears to the right of the identifier and describes where in the system the process takes place. This may, for example, be a department or a piece of hardware. Finally, a descriptive title is placed in the center of the box. This should be a simple imperative sentence with a specific verb, such as 'maintain customer records' or 'find the driver.'
Data Store - A data store is a holding place for information within the system. It is represented by an open-ended narrow rectangle. Data stores may be long-term files such as sales ledgers or short-term accumulations: for example, batches of documents that are waiting to be processed. Each data store should be given a reference, followed by an arbitrary number.
Data Flow - A data flow shows the flow of information from its source to its destination. A data flow is represented by a line with arrowheads showing the direction of flow. Information always flows to or from a process and may be written, verbal or electronic. Each data flow may be referenced by the processes or data stores at its head and tail, or by a description of its contents.
Resource Flow - A resource flow shows the flow of any physical material from its source to its destination. For this reason, they are sometimes referred to as physical flows.
The physical material in question should be given a meaningful name. Resource flows are usually restricted to early, high-level diagrams. They are used when a description of the physical flow of materials is considered to be important to help the analysis.
How to Create a Data Flow Diagram?
To create a valid DFD, it’s important to follow the 4 rules of thumb. They offer the best guide to create data flow diagrams.
- Every single process should have at least one input and one output.
- Each data store should have at least one data flow in and data flow out.
- Every system’s stored data has to go through a process.
- Every process in a data flow diagram must link to another process or data store.
With the background information on DFDs and the rules of thumb, you can build your own DFD. The process entails the following five steps:
1. Identify the major inputs and outputs in your system
This step gives a macro view of your system and elucidates the broadest tasks the system should achieve. Again, the rest of the DFD is built on these elements.
2. Build a context diagram (Level 0 DFD)
You could achieve this by drawing a single process node and connecting it to related external entities. The node represents the general process information undergoes in a system from input to output.
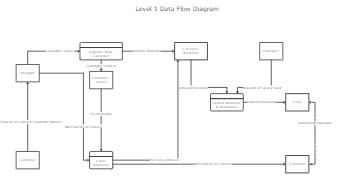
3. Expand the context diagram into a level 1 DFD
Level 1 DFDs are more of a general overview, but they give more detail than a context diagram. Break the single process lump into detailed processes. This brings out where the information starts and what needs to happen to it.
4. Expand to level 2+ DFD
This breaks the processes down into more detailed subprocesses. Ensure you add any necessary data stores and flows at this point.
5. Ascertain the accuracy of your final DFD
Walk again through your diagram as you pay close attention to the flow of information. If it makes sense and all necessary data stores are included, then thumbs up. Other parties should find your diagram comprehensible.
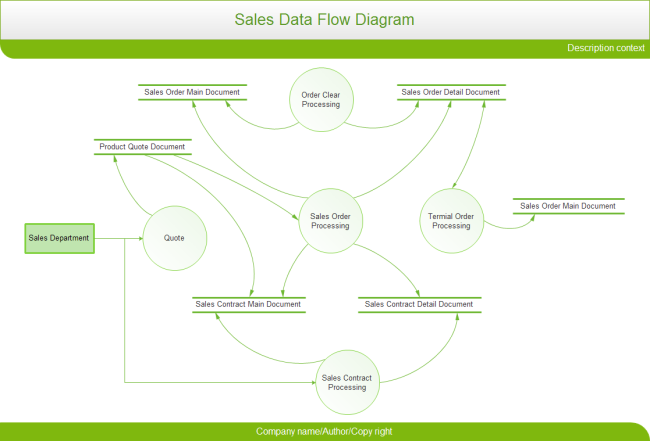
Data Flow Diagram (DFD) Examples
Let’s see how these symbols used in the data flow diagram. You can create a clear data flow diagram effectively with EdrawMax!
1. Sales Data Flow Template
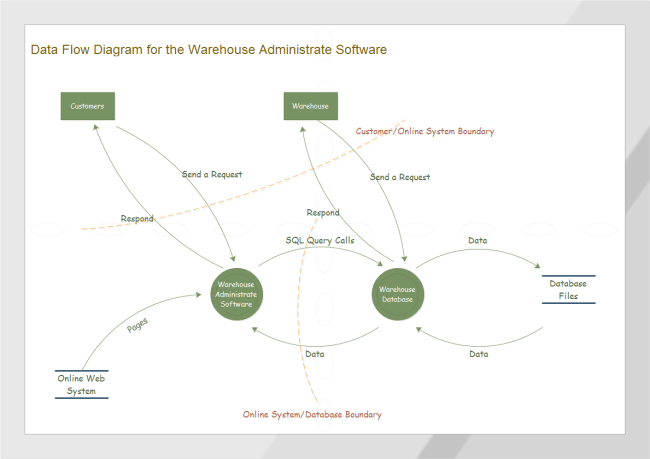
2. Warehouse Data Flow Diagram Template
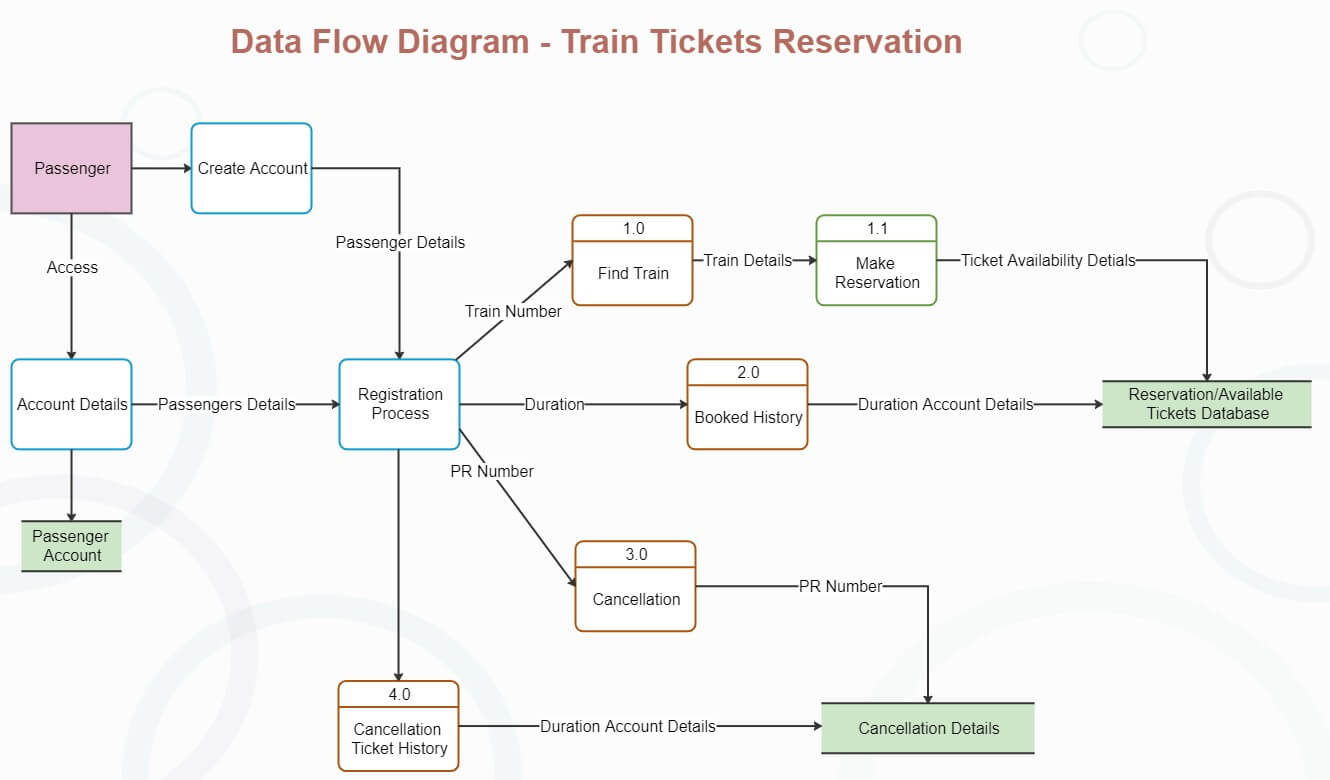
3. Train Tickets Reservation DFD
Conclusion
Businesses are built on systems and processes without which they'd prove challenging to operate. How team members interact with the systems significantly affects process efficiencies.
Data flow diagrams provide essential information about a system's input, output, and processes, and countless insights on analyzing and improving efficiency. Whether you're improving an existing process or implementing a new one, a DFD will make your task easier. You could download relevant templates from EdrawMax and create your own DFD.
More Related


