How to Make a Comparison Chart Easily
Part 1: What is a Comparison Chart?
A comparison diagram is used to compare two or more data sets based on certain parameters. The comparisons can be expressed through words, numbers, or even symbols such as ticks and crosses.
Comparison diagrams are useful in several situations in everyday life. For example, a customer might use them to determine which of two options is best for them when deciding between two products. Businesses can decide which course of action to take after comparing all of the different factors and variables.

Part 2: Why Use Comparison Charts?
If you are searching for something to buy, a comparison chart offers information about different options, comparing their pros and cons in regard to prices, reviews, features, and so on. In this visual way, you can find your favorite option easily.
If you are a seller, you are much more likely to convert browsers into buyers by posting such shopping comparison charts with little or even no cost. The prerequisite is that you can provide all the detailed information they need so that they can do analysis and know your offers well.
Research and collect your data so that you clearly know what to compare. Items to be compared should be held to similar standards. Select the top products to review. The readers will not trust companies that are not recommending the best products. The next step is to find out what features to compare.
Part 3: How to Create a Comparison Chart
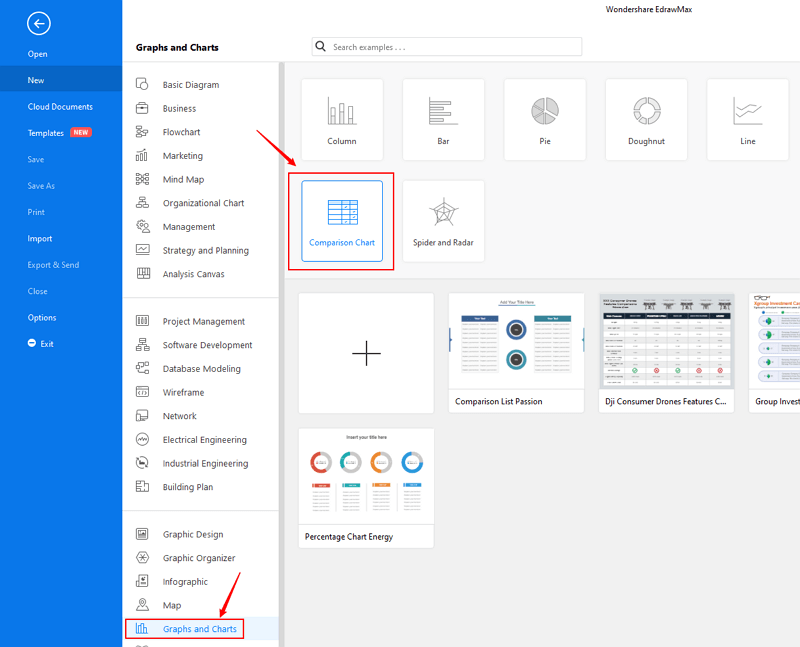
Step 1: Open EdrawMax from your computer, and navigate to [New] > [Graphs and Charts] > [Comparison Chart].
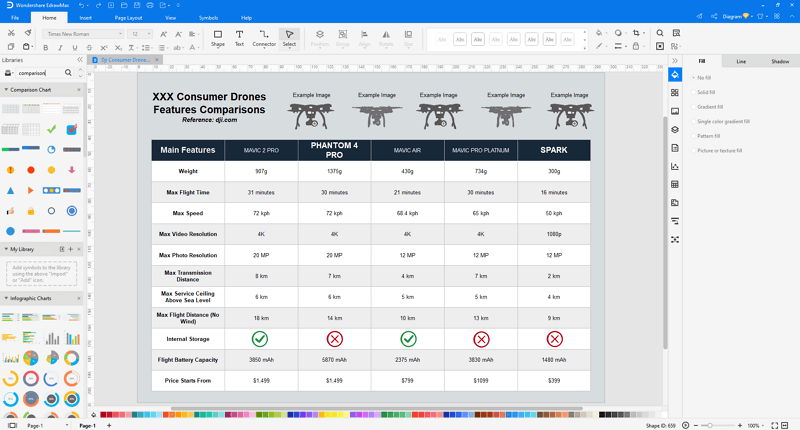
Step 2.1: Choose a pre-made template from the template gallery and open it. You will see the chart on the canvas with a lot of editing tools on the top menus and right panes.
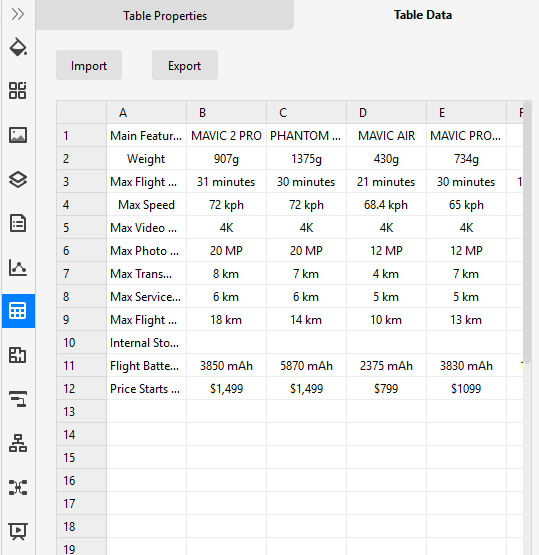
Step 2.2: After you open a blank comparison chart template or insert one on the canvas, you can import the data by uploading files (XLSX or CSV) or pasting the data on the windows.
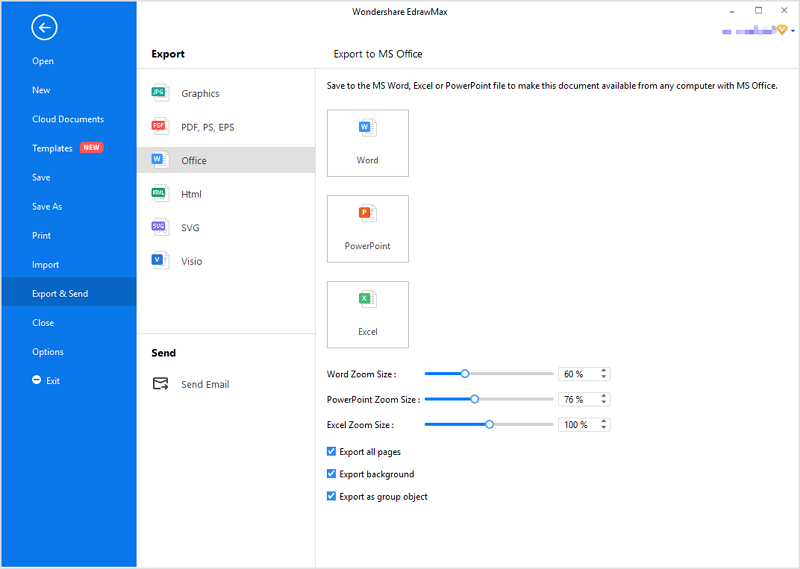
Step 3: When the column chart is finished, you are able to save and export the creation to graphics(JPG, PNG), PDF, editable MS Office file format, SVG and Visio vsdx file format.
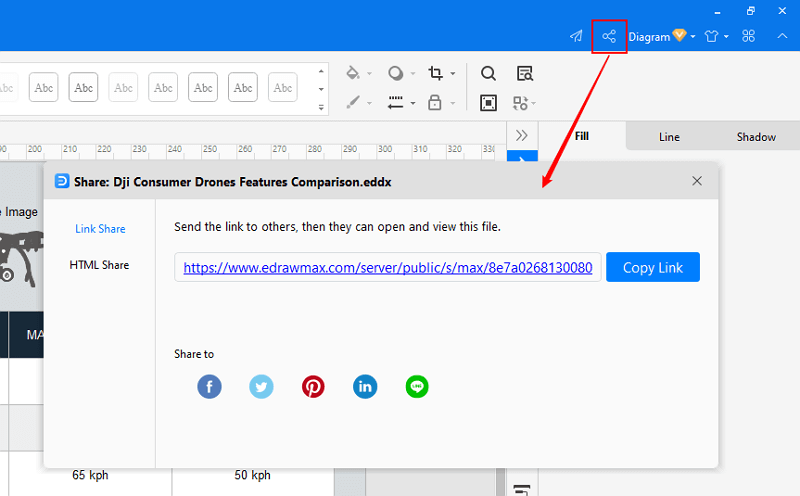
Step 4: Alternatively, you can share the chart via social media and sharing links. In addition, you can publish your diagram into EdrawMax's online template gallery.
EdrawMax
All-in-One Diagram Software
- Superior file compatibility: Import and export drawings to various file formats, such as Visio
- Cross-platform supported (Windows, Mac, Linux, Web)
Part 4: Comparison Chart Examples
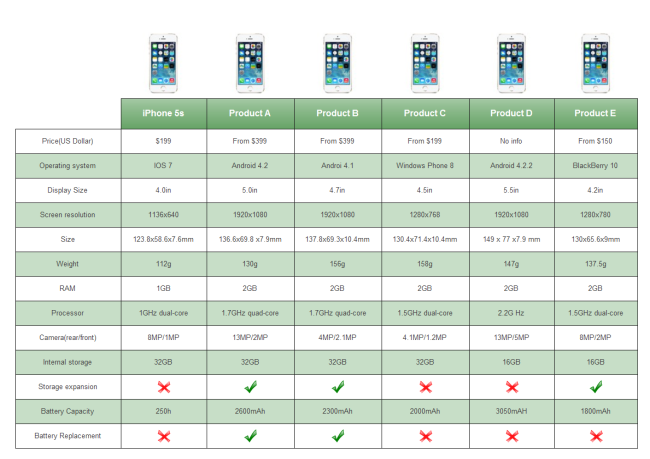
Example 1: Smart Phone Comparison Table
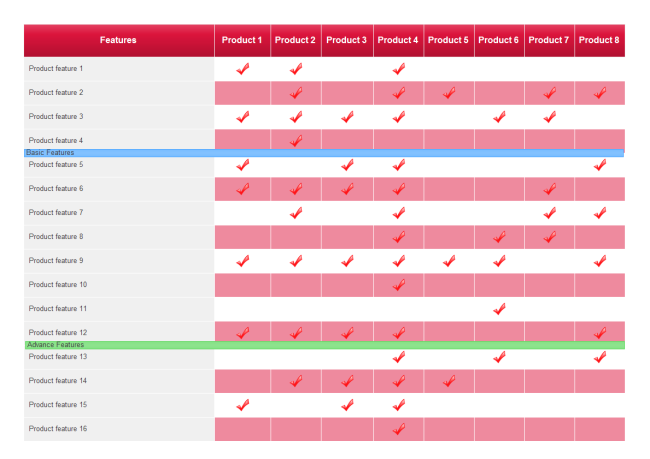
Example 2: Product Comparison Table
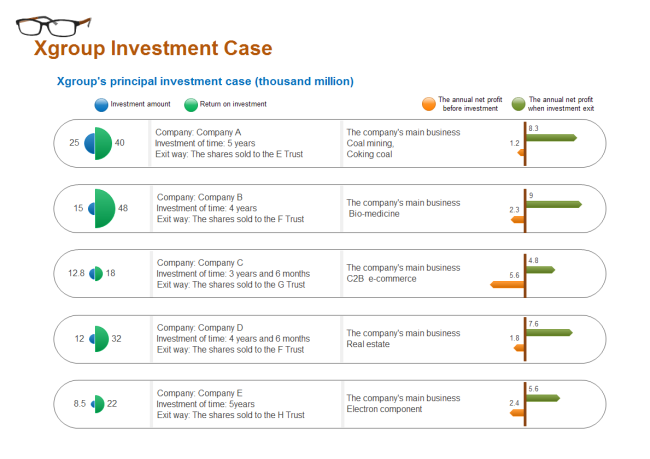
Example 3: Group Investment Case
More Related
Basic Comparison Chart Knowledge

