Context Diagram
- Part 1: What is Context Diagram
- Part 2: Purpose and Benefit of Context Diagram
- Part 3: Context Diagram Symbols & Elements
- Part 4: What to do Before Creating Context Diagram
- Part 5: How to Make Context Diagram in EdrawMax
- Part 6: Tips for Making a Perfect Context Diagram
- Part 7: Context Diagram Example
Part 1: What is Context Diagram
Well, let’s start by defining what it is first.
A context diagram “is the highest level in a Data-flow Diagram (DFD) showing the relationship between a system and other external entities.” The external entities can be external data stores, organizations, systems, etc. Every context diagram must have a context bubble, which is first drawn in the center of the chart.
NOTE: This visual representation diagram is perfect for data analysts since both the DFDs and Context Diagrams were created for systems analysis and design purposes.
Part 2: Purpose and Benefit of Context Diagram
Since a Context Diagram is a specialized version of DFD, therefore, it has two chief purposes, which are:
a. Created to help system analysis
b. It perfect for system design
Some of its benefits include:
i. It is beneficial to several audiences, including system developers, data analysts, business analysts, and stakeholders.
ii. It can be expanded with ease by simply adding different levels of DFDs
iii. To understand the context diagram, you don’t require any technical knowledge
iv. Since it features limited notation, it is quite easy to draw and amend it
v. It displays the system’s scope and boundaries, including its other interfacing systems
Part 3: Context Diagram Symbols & Elements
The elements of a context diagram include:
1. Product: This is the core and the critical element of a context diagram, and it is represented by a circle. A product, therefore, denotes a system, process, or business entity being focused on.

2. External entities/agents: This represents external systems, organizations, or people who consume data or provide data to your product. A square or rectangle, therefore, denotes this symbol.

3. Data flow: This symbol is represented by an arrow, which means or shows how data interact with its external entities.

Part 4: What to do Before Creating Context Diagram
Before you embark on creating a context diagram, you need to know or do the following things:
Part 5: How to Make Context Diagram in EdrawMax
EdrawMax is an online multipurpose chart maker that can be sued to create several types of graphs or visual diagrams. It is one of the best optical diagram makers, thanks to its interactive interface with an easy-to-use workspace.
Follow the steps below to design your diagram with EdrawMax:
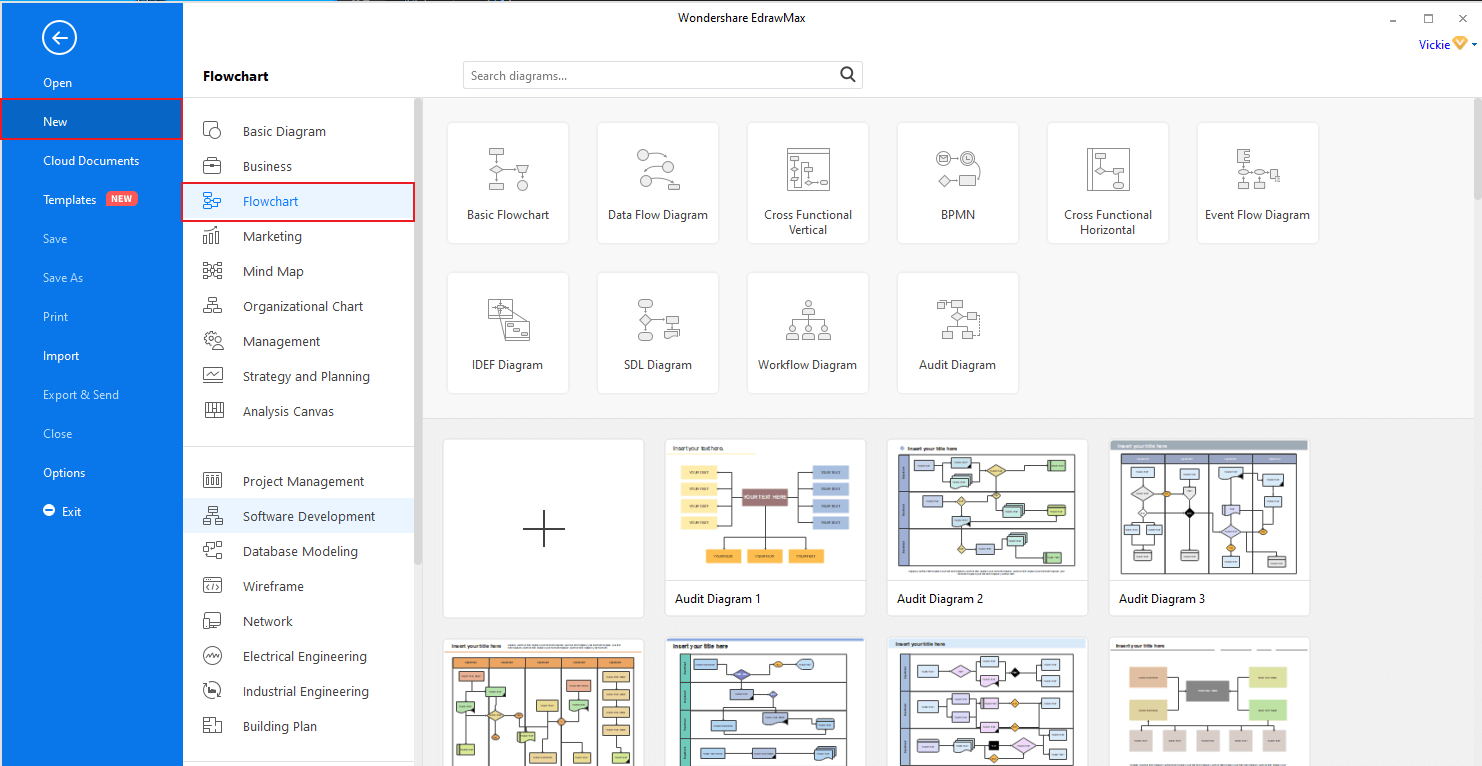
Step 1: Click "New" on the left navigation pane and the "Flowchart" and wait for it to load. After it is done loading, click on “Data Flow Diagram,” and a new page will load. In there, you will see several templates, but most of them are not for Context text, so you will have to create from scratch.
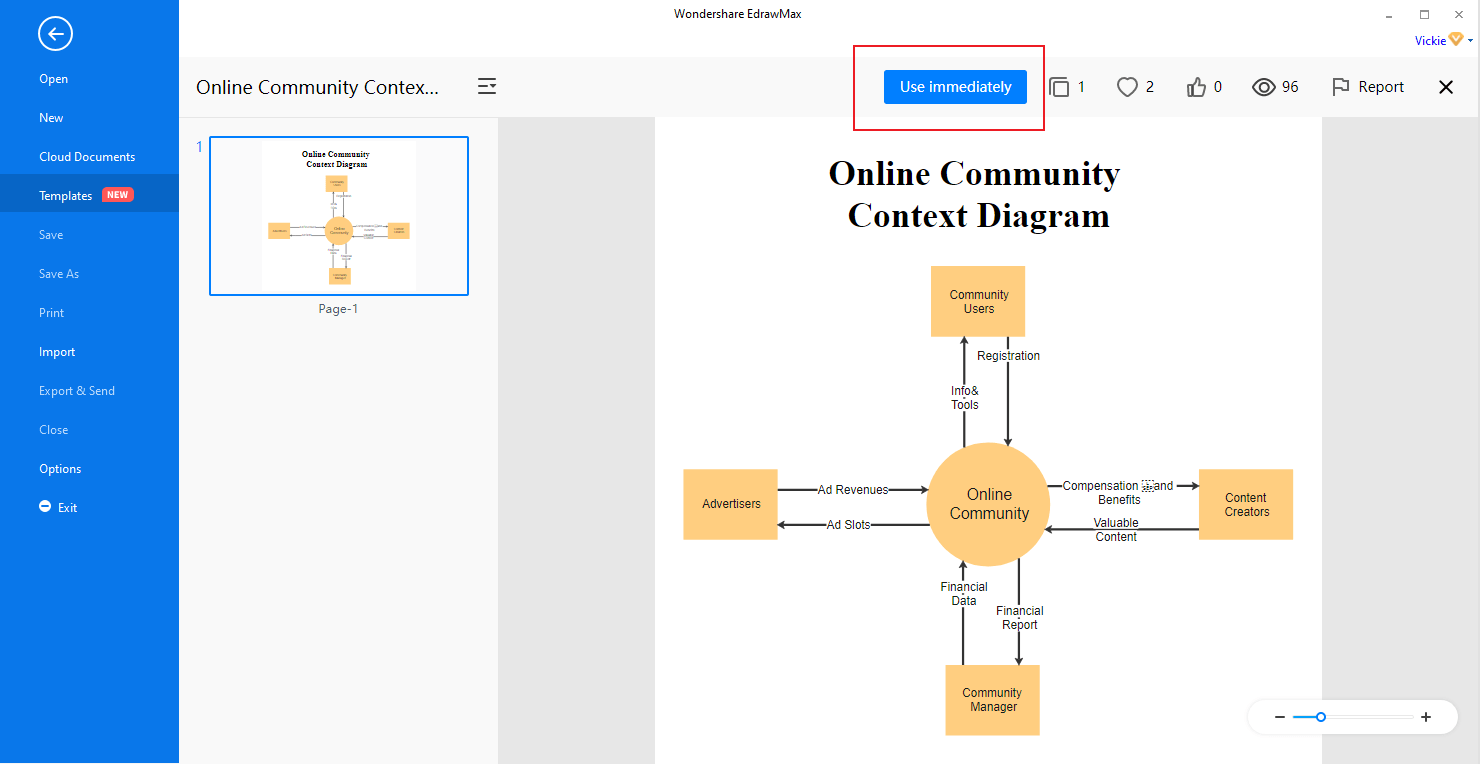
Step 2: To look for available templates to modify, head back to the homepage, and on the top navigation pane, click “Templates” and then search for the keyword “Context Diagram.” Let it load, and then browse through the templates and select the one you like. Click on “Use Immediately” and modify it to meet your requirements.
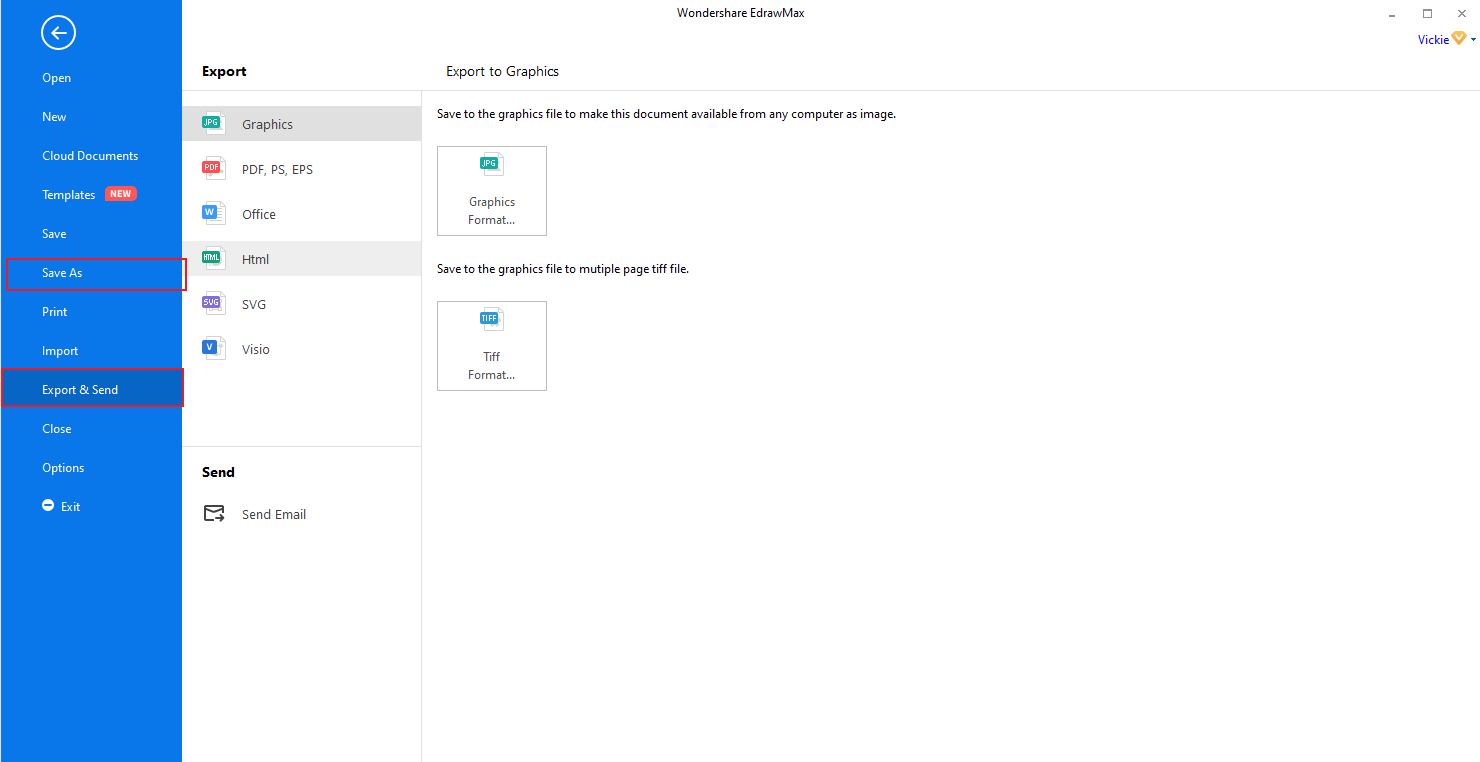
Step 3: Export your finished diagram by clicking on “File” “Export” and choose a format you will like to have it in.

An all-in-one platform for 210+ diagrams.
・ Simple alternative to Visio
・ 26k+ symbols
・ 10K+ free templates
・ 10+ AI diagram generators


Part 6: Tips for Making a Perfect Context Diagram
Here are some of the essential tips to ensure that you make a context diagram that stands out.
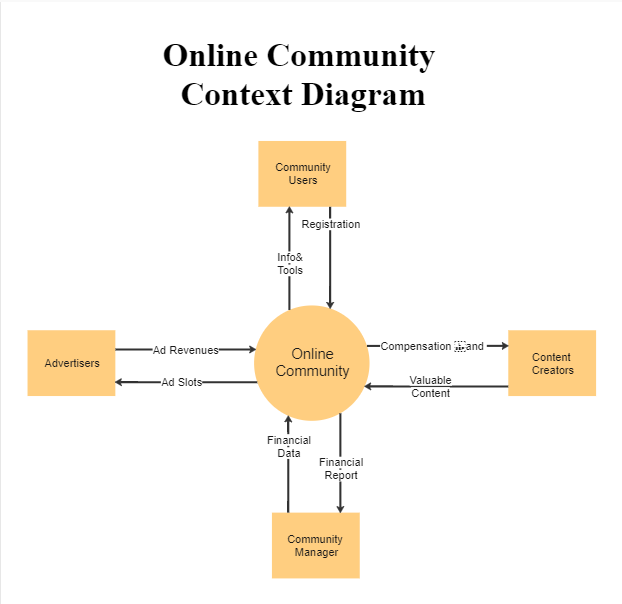
Part 7: Context Diagram Example
The example below shows a simple way of how you can design your context diagram. The noticeable features of this Online Community context diagram are: