Value Stream Mapping Software - Create a Value Stream Map Rapidly
Create a Value Stream Map
Value stream maps are a popular way to find waste in a company's processes - steps that do not add value to the end product.
Value Stream Mapping Software
Download Value Stream Mapping Software Free and View All Templates
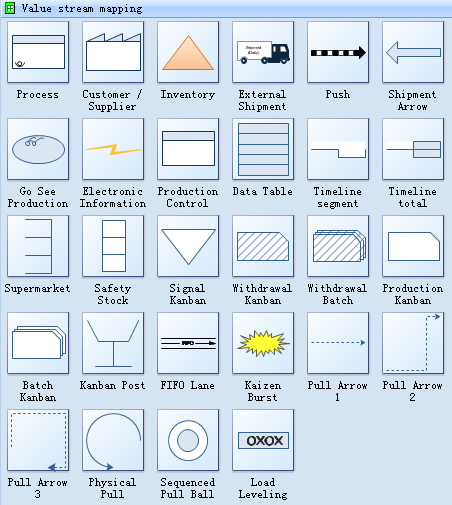
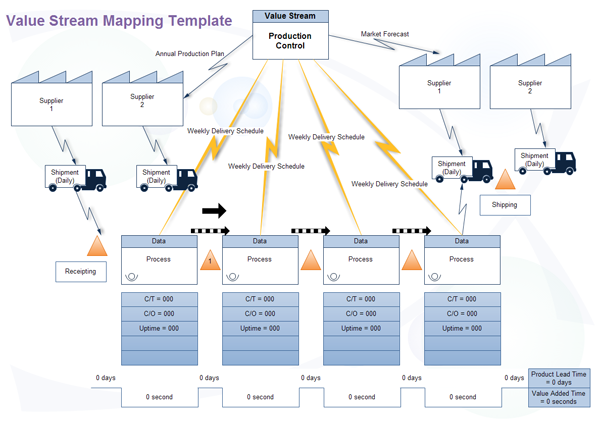
Value Stream Mapping Templates
The following value stream mapping shapes include the basic process, supplier, control, shipment, push, information and data table shapes.
The value-added flowchart is a mechanism to improve cycle times and productivity by visually separating value-adding from non-value-adding activities. The process is very straightforward, as outlined below:
-
List all of the steps in a process from beginning to end.
-
Create a diagram with a box for every step, in sequence.
-
Calculate the time currently required to complete each step of the process, and add that time to the box.
-
Add the time in each box to yield the Total Cycle Time.
-
Identify those steps that do not add value to the process. Non-value-added operations include: inspection, test, rework, set-up, inventory buffers, product movement other than customer delivery - any activity that does not improve the form, fit, or function of the product on the first passes through the process.
-
Move the boxes representing non-value-added processes to the right of the value-adding steps.
-
Add the time in each of the non-value-added processes to yield the Non-Value-Added Cycle Time. This is the waste that could be eliminated if only value-added steps were performed.
-
Add the time in each of the value-added process to yield the Value-Added Cycle Time.
-
Calculate the percentage of the Total Cycle Time that is a function of Non-Value-Added operations. You may wish to construct a pie chart to communicate the analysis.
-
Identify the target process configuration using benchmarking and best-in-class analysis.
-
Diagram the target process and determine the Total Target Cycle Time.
-
Analyze the Non-Value-Added steps to find out actions to reduce or eliminate these operations.
-
Analyze the Value-Added steps to identify improvement opportunities and implement actions to reduce the cycle time.
-
Diagram the improved process, compare with the target process, and identify gaps for further improvement actions, in an on-going cycle until the target is achieved.
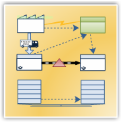
Value Stream Mapping Example
The following image is created by Edraw max. It's a basic value stream mapping example. You can edit it in the software.
Business Process Model Software


