How to Make a Flowchart
Edraw Content Team
Do You Want to make Your Flowhcart?
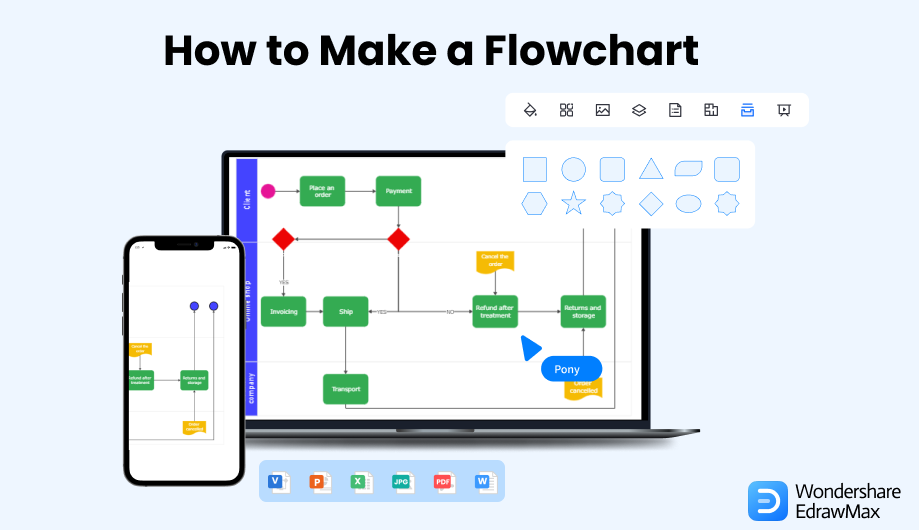
EdrawMax specializes in diagramming and visualizing. Learn from this article to know everything about how to make a flowchart with ease and free flowchart templates. Just try it free now!
A flowchart is an excellent way of presenting complex ideas in a graphical and easy-to-understand format, even for beginners. You can organize your thoughts better and share information with others if you know how to make a flowchart.
Aside from that, nearly all industries and professions use them. Flowcharts are documents used by many people over the organization, so you'll need to understand them. This article will explain why you should use flowcharts and show you how to do it. We'll also cover some tips on creating a flowchart to help you out.
1. Make a Flowchart in 8 Steps
To create a flowchart, you can download software or make it online. No matter how you do it, ensure the flowchart includes all the required information. Also, have every detail clearly labeled and easy to read. It means you should use plain language to make it easy to follow. Keep reading to learn how to create a flowchart with these eight steps.
Step1 Know the Purpose of the Flowchart
A flowchart is a diagram that helps organize and visualize data or processes. It is an effective way to present information, explain concepts, or communicate important information. But it's not enough to know how to make a flowchart; you must also appreciate why. That will help you figure out what information is most important. Designing new products or services, for example, involves flowcharts.
Your goal could be to help others visualize data or troubleshoot issues. Your purpose may also depend on who will use your flowchart. Unless it's for internal use, you can make it general. If you want to share it with other departments or outside parties, make it more specific to avoid confusion.
Step2 List the Steps and Decisions on the Draft
Before you make a flowchart, write all the steps. It will help you organize your thoughts and make the process easier. You can look at existing data on the process or system in question. That might include:
- Observing how team members work together and what problems arise when they do so.
- Reviewing documentation that explains how the process currently works and where it fails.
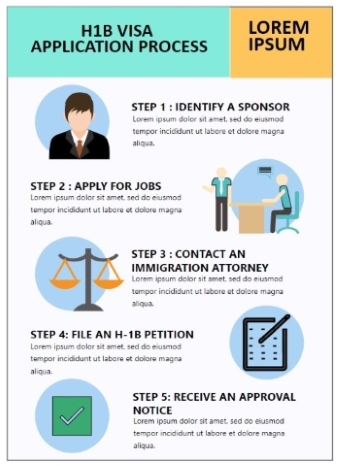
This procedure will teach you how things work so that you can make changes to improve the process. Below is a photo showing the steps to applying for a visa.
Step3 Select a Proper Flowchart Maker
If you don't know how to make a flowchart, use software that has various templates, symbols, and other features. You can create flowcharts using Microsoft Office tools such as Excel, Word, or PowerPoint. These tools, however, have some limitations, like a small drawing canvas, few sharing options, and no real-time team collaboration.
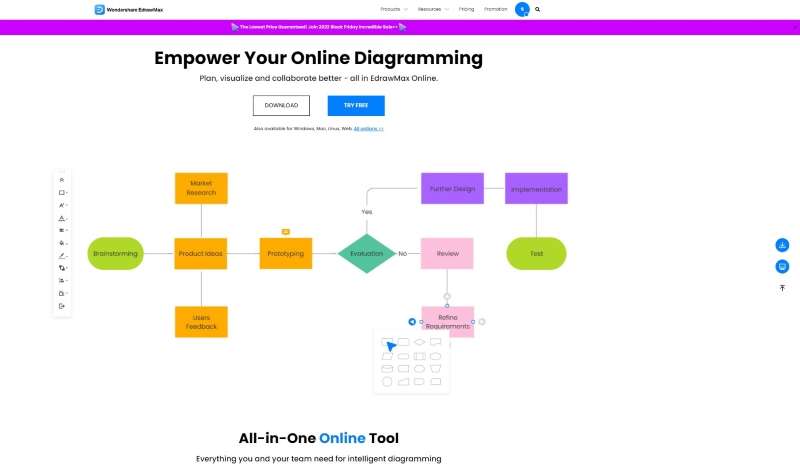
EdrawMax lets you create flowcharts from scratch or use templates on its endless canvas and user-friendly interface with its online and downloadable software. It also allows you to customize them by adding text or changing colors. With EdrawMax Online, you can work with your team in real time.
Step4 Make a Flowchart from a Blank Canvas or Template
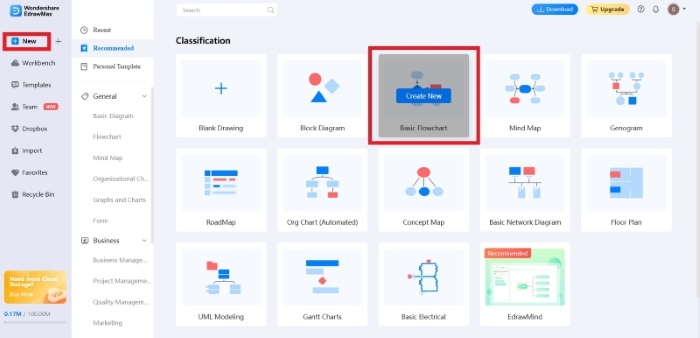
Choose the appropriate diagramming technique. Flowcharts come in several types, so pick the one that works best for your task. Create an account and sign in to EdrawMax Online. To build a new flowchart, click New in the left-side navigation pane. Then click Basic Flowchart under Classification.
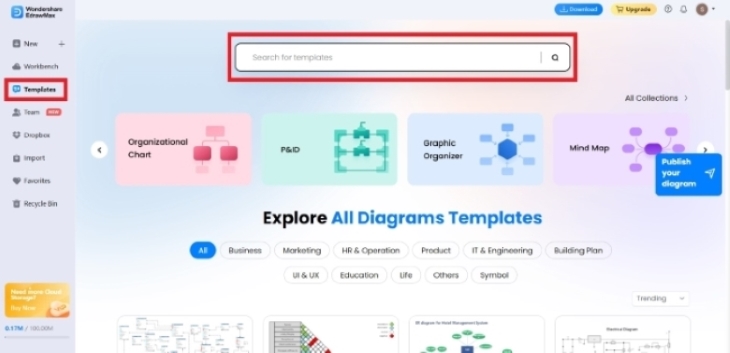
You can find over 1500+ built-in templates on the EdrawMax community if you need ideas on how to make a flowchart. On the left-side menu, click Templates. In the Search for templates box, enter the template you prefer. You'll find the search results down on the page. Select from the different flowcharts and diagrams available.
Step5 Add Shapes and Symbols
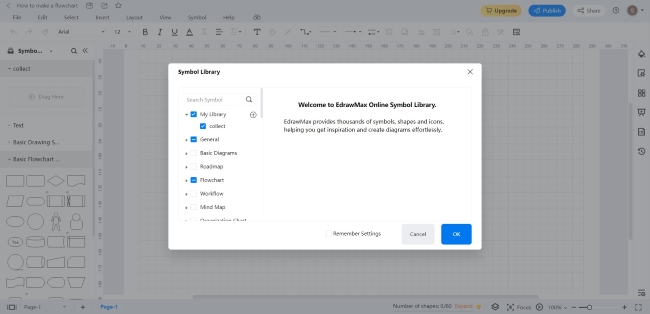
Make labels and text boxes simple. But keep it visually appealing and easy to understand at a glance. Select from over 26,000 symbols to make your flowchart more intuitive. One thing to understand when learning how to make a flowchart is the popular symbols used in a flowchart. When you pick a template or diagram on EdrawMax, related symbols and shapes should appear automatically. If not, click Symbol Library in the left-side navigation panel. In the Symbol Library dialogue box, select Flowchart and click OK.
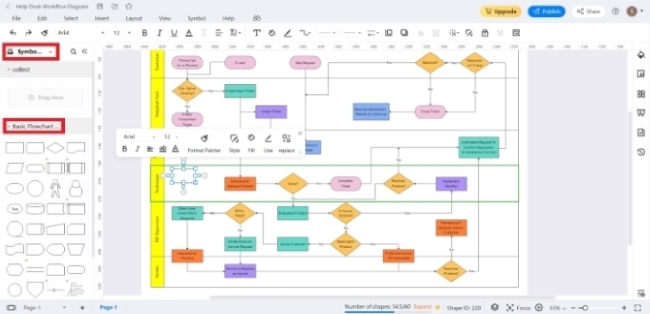
To add more symbols from the Symbol Library menu in the left-side navigation pane, click Basic Flowchart, then choose a symbol. Drag and drop it on your drawing canvas.
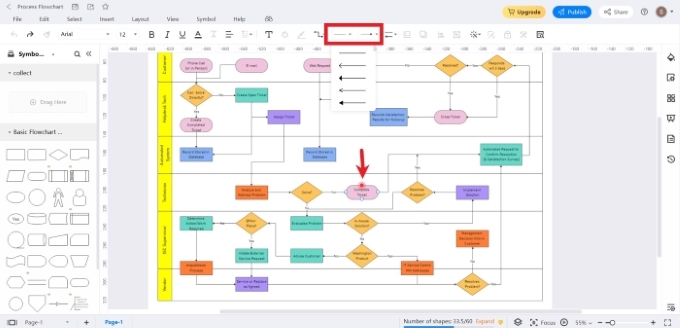
Step6 Connect the Shapes with Lines and Arrows
Flowcharts use logical lines and arrows to connect things. But make sure that the arrow lines point in the correct direction of the process. If someone looks at it, they should be able to figure out what it means without reading through all the instructions. Also, ensure that the lines won't cross each other unnecessarily. Click on the shape on your drawing canvas to add a start or end arrow line. Point your cursor on its side until you see a red point. Click on the red point and connect it to another shape on your canvas. It should automatically create the arrow lines for you. You can also click the Line and Arrow symbol on the top navigation pane for the start or end lines and arrows.
Step7 Optimize the Flowchart Appearance
Take a few steps to make your flow chart more understandable and easier to use. Getting rid of unnecessary items will also reduce clutter. The following are more ways to style your flowchart.
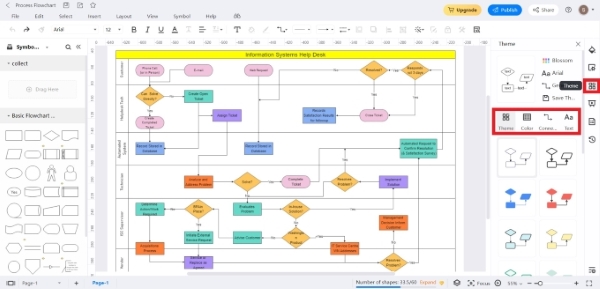
Choose a Theme: On the right-side navigation section, click the Theme icon. Customize your flowchart's theme, color, connector style, and text font from there.
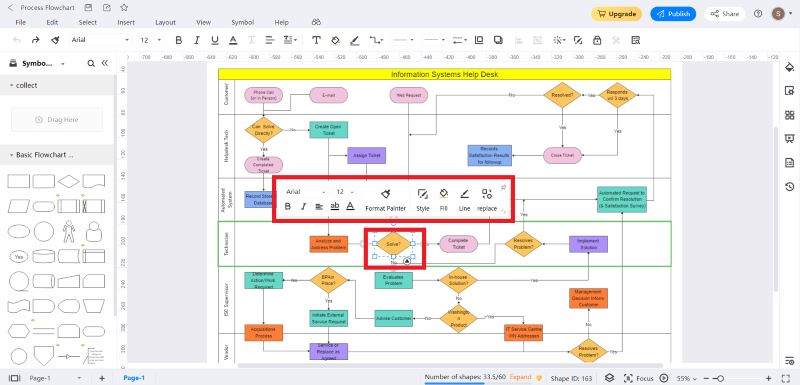
Customize Shape Format: You can use color coding when appropriate for the shapes. Click the shape you want to edit to change its design. It will show a Style/Fill/Line pane. Adjust to suit your preference.
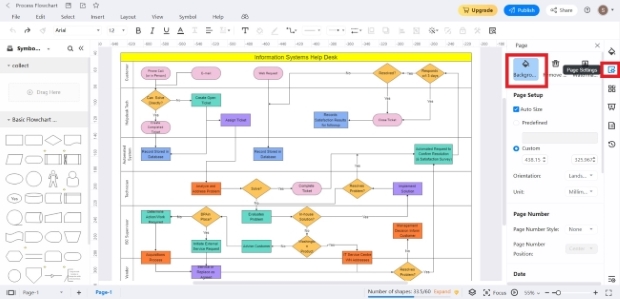
Custom Background Colors: EdrawMax Premium users get custom background colors and more. To see more options, click the Page icon in the right toolbar. Select Background in the Page settings.
Step8 Optimize the Flowchart Appearance
Save as a Cloud File: Publish your flowchart and save it to your cloud, Google Drive, or Dropbox. From the top menu, choose File>Save as>Cloud file.
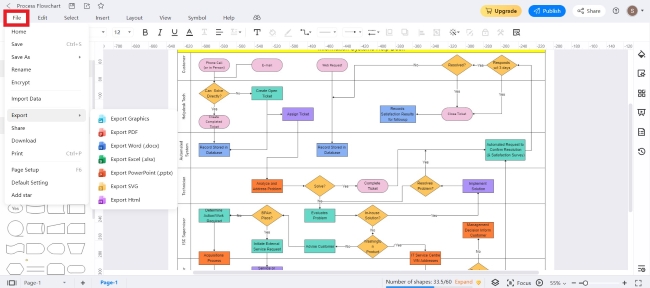
Export to Several File Formats: Several file formats are also available in EdrawMax. You can export your flowchart as a PDF, Word, Excel, PowerPoint, and more. From the top navigation bar, choose File>Export. Then select your preferred file format.
Spread the Word: Your flowchart is also easy to share with your team through a URL link, social media, or embedding its HTML. From the top navigation pane, choose File>Share.
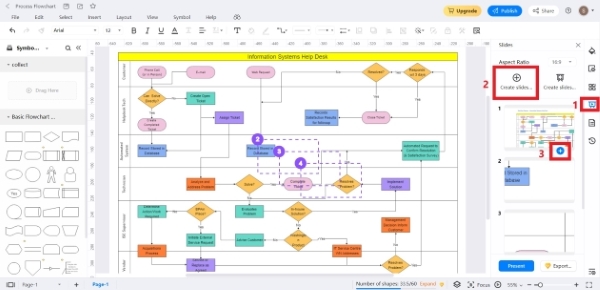
View in Presentation Mod: Create slides from your flowchart to communicate with others. Click the Slide icon from the right-side navigation menu. In the Slides settings, select Create Slides Manually. To add more slides, click the + icon below each slide. Click Present.
2. Free Flowchart Templates
Understanding how to make a flowchart as a beginner can be overwhelming at first. Discover how to create a flowchart using these free templates from EdrawMax. Get creative with these flowchart types.
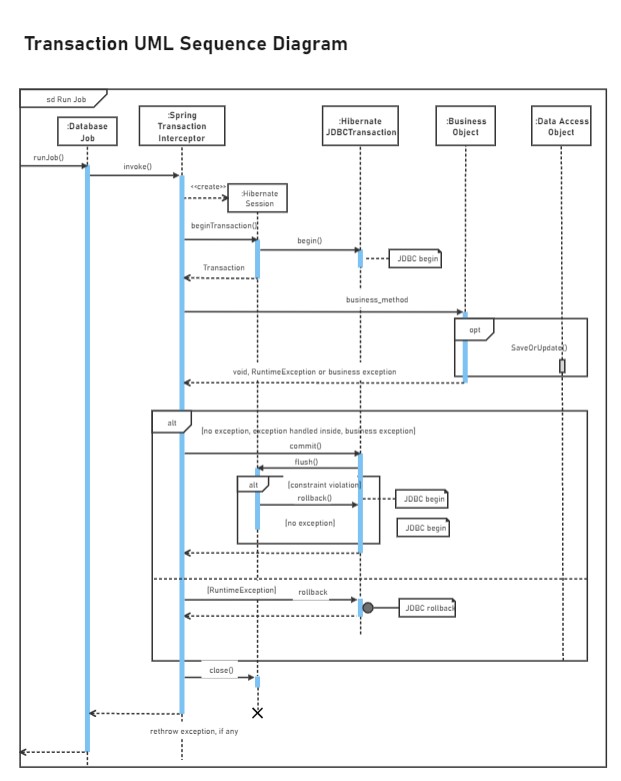
Example 1: Transaction UML Sequence Diagram
A sequence diagram is valuable for explaining a system's architecture and needs. It is helpful because it shows the logic of how the items interact in order.
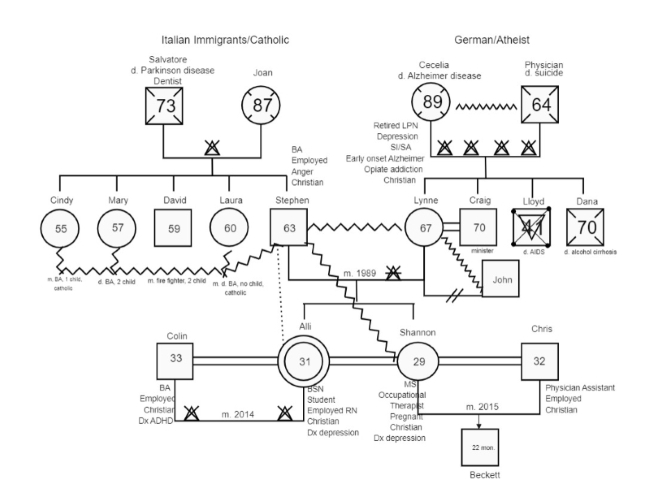
Example 2: Alli Genogram
A genogram shows the medical background of a family. It gives doctors visual information to help them assess who is at risk for hereditary diseases.
Example 3: Fishbone Diagram Medical
A cause-and-effect diagram is a tool that aids in locating, classifying, and displaying the causes of a specific issue or trait. This diagram shows how all the influencing factors lead to a particular outcome.

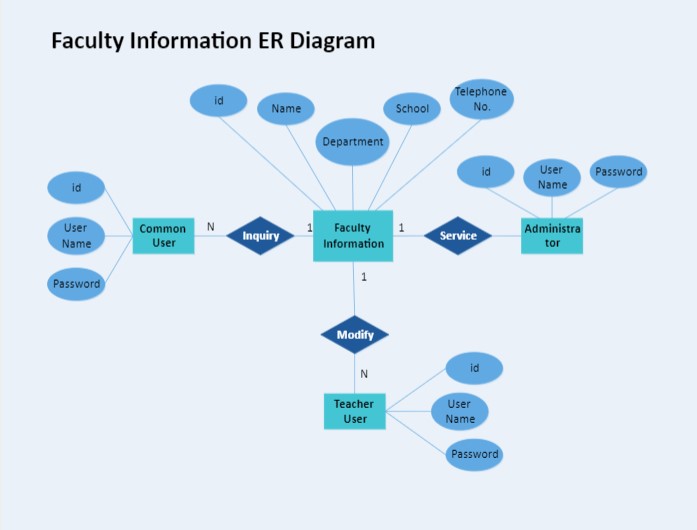
Example 4: ER Diagram
An Entity Relationship Diagram (ER Diagram) shows how things, people, and concepts in a system relate to one another.
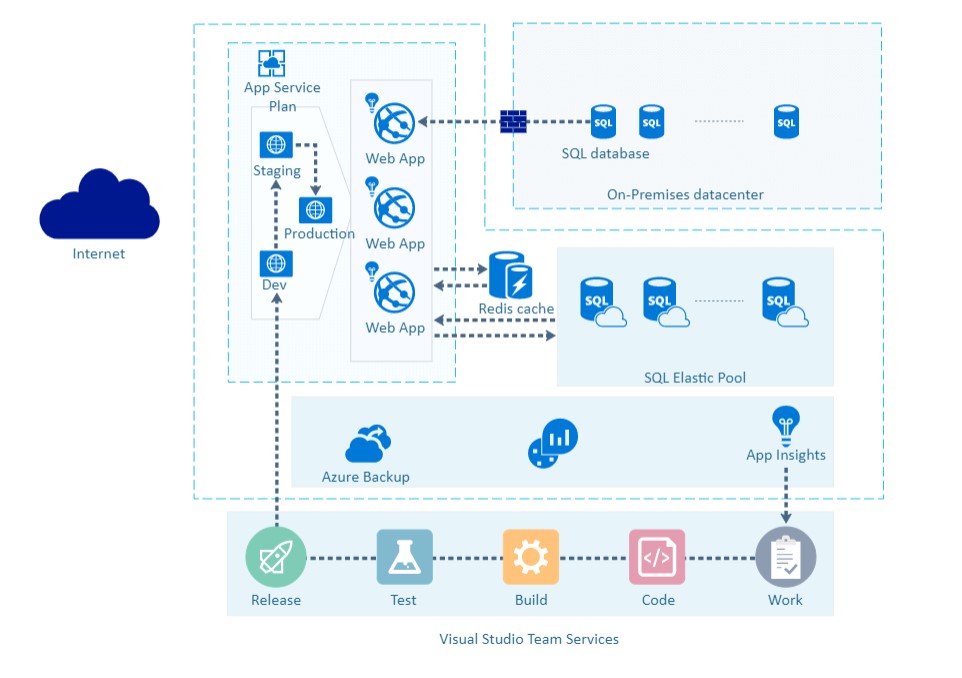
Example 5: Azure Network Diagram
Project network diagrams show what's going on in a project in graphical form. It shows the relationships between actions in the project, task orders, and the need to do some things before others. The line's width, color, and arrowheads convey details about the relationship, showing how strong it is.
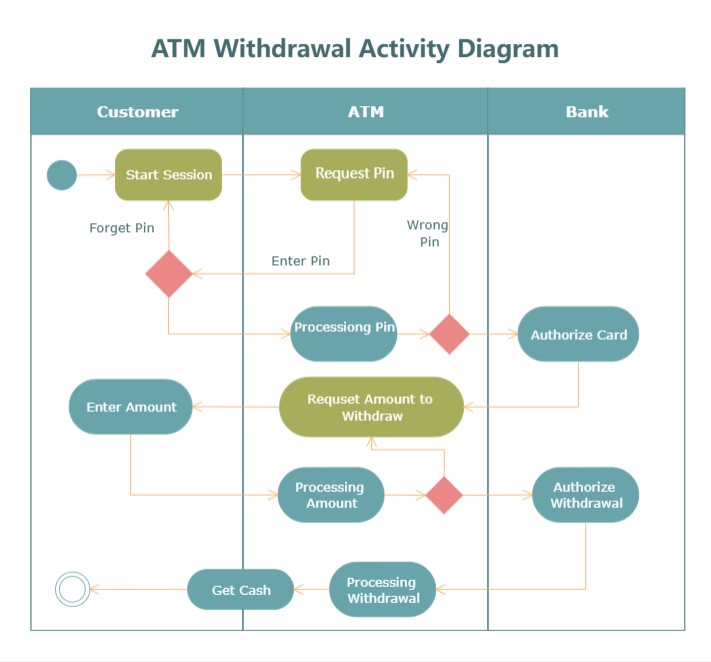
Example 6: ATM Withdrawal Activity Diagram
Activity diagrams help define business processes and record how systems work. People, computer components, or software can all perform these tasks.
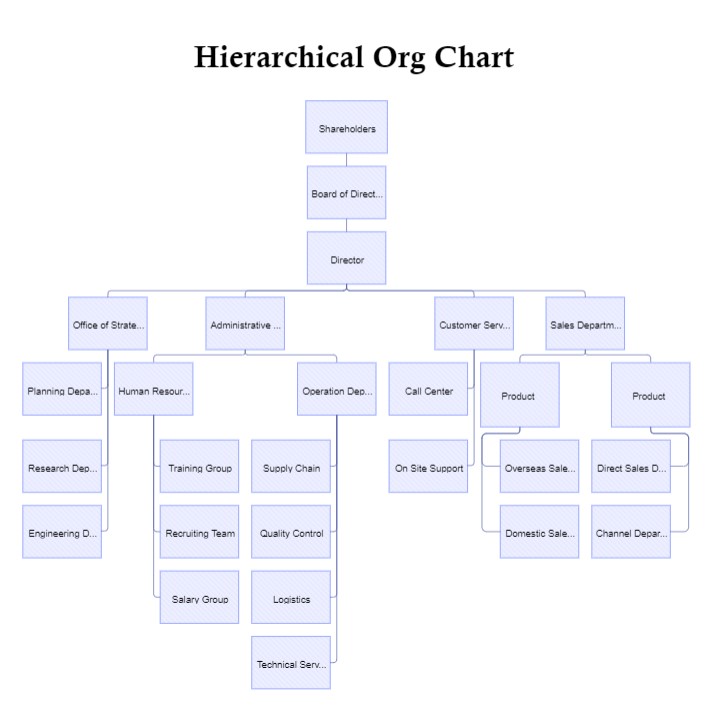
Example 7: Hierarchical Organization Chart
Often called hierarchy charts, organizational charts show the structure of an organization. Its goal is to depict the chains of command and reporting connections inside the company.
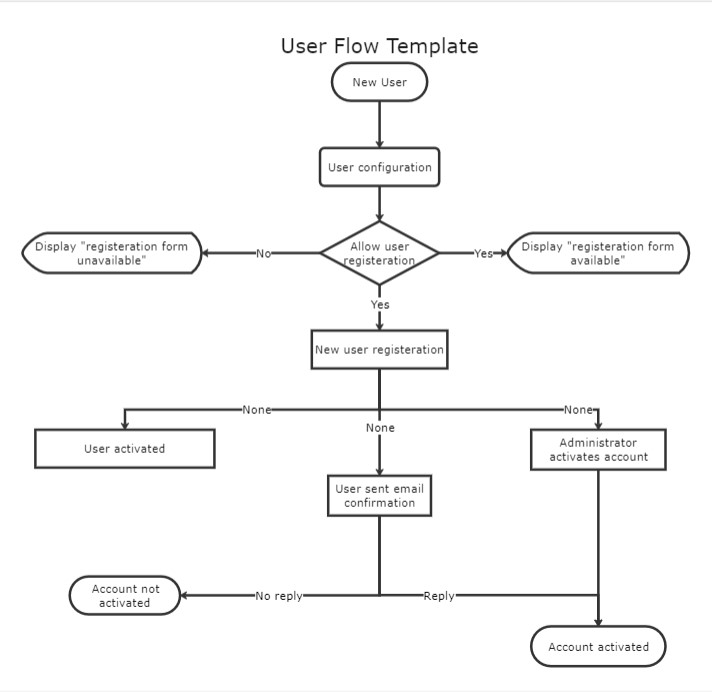
Example 8: User Flow Chart
A user flow shows the steps a user takes to do something in a program. UX teams use user flow diagrams to determine the flow of a website or app based on the user experience and their demands. User flows help product teams design intuitive products, give users relevant information at the right time, and make things easier.
3. Practical Tips for Making a Good Flowchart
People often use flowcharts to help them understand things. Use them for communication, learning, or just planning. No matter what you use them for, here are some practical tips on
- 1. Use the Same Color Scheme and Readable Font Style and Size:
- 2. Scale the Flowchart:
- 3. Create a Consistent Flow Direction:
- 4. Apply Coherent Branch Direction:
- 5. Keep Even Spacing Between Shapes and Symbol:
Don't use too many colors in one chart. It means using the same color scheme throughout your flowchart. Try not to use fancy fonts, and ensure your font is big enough to see all the text without squinting. It also makes it easier for viewers to follow and create a more cohesive look.
Too frequently, a comprehensive flowchart gets shrunk to fit on only one page. There are two approaches to managing this. The first is to make the flowchart more concise and represent all your ideas on the page. Alternatively, break up your flowchart into smaller diagrams and separate them.
Most flows are top-to-bottom or left-to-right, but you shouldn't mix these directional flows. The flow should be in the same direction throughout. The arrows should all go left to right if your flowchart goes left to right. When you use a top-down flowchart, your arrow lines should always point down.
Please don't confuse the reader by starting with something and changing it midway through. It is necessary if you're putting together a flowchart to explain something complex. Using Decision symbols is the easiest way to illustrate this. It is ideal for TRUE circumstances to flow out from the bottom and FALSE situations to flow out from the right.
You can do this by using the same size and shape of the symbol. Also, ensure that all your symbols are on the same horizontal or vertical line. EdrawMax has a grid in its drawing canvas to help you achieve even spacing and proper alignments. The more uniform your spacing is, the more professional your flowchart will look.
4. Final Thoughts
Creating flowcharts for personal reasons or work will help you structure your ideas and work processes. Although making a flowchart may seem difficult at first, with EdrawMax learning how to create a flowchart is easy. But before you begin, keep in mind that there are some considerations you should follow to make your flowcharts look as professional as possible.

Flowchart Complete Guide
Check this complete guide to know everything about flowchart, like flowchart types, flowchart symbols, and how to make a flowchart.
You May Also Like
Create Floor Plans on Mac
How-Tos
How to Create a Genogram Quickly
How-Tos


