Pyramid Diagram
Part 1: What is a Pyramid Diagram?
A Pyramid Diagram is also called a triangle diagram or a triangle chart. It looks like a triangle divided into horizontal sections. Pyramid diagrams are used to arrange items or concepts to show hierarchical structure. It shows the contents in a progressive order like business management positions, products sold, business locations, etc.
The location and width of each section show the level of the unit in the hierarchy. For example, the wider the unit, the more general it is. As we keep moving upwards, the width shrinks, and the topics become more specific.
Part 2: Purpose and benefit
Pyramid charts can be used for multiple purposes. It’s used in many ways depending on the requirements. It can be used to;
- Pyramid Diagrams can be used as a tool to represent research data.
- It can also describe an organizational hierarchy.
- When you have to explain a process or its constituents of the process.
- Pyramid Diagrams are a great way to explain and visualize categories, classification, or grouping of data and information.
Part 3: Types of Pyramid Diagram
Pyramid Diagrams can be made in a variety of types depending on the circumstances.
A classical Pyramid Diagram is in the form of an equilateral triangle. This triangle is divided into horizontal sections of equal height. The width of each section varies from being smallest at the top of the pyramid and increases towards the bottom of the pyramid. The width of each section shows the level of hierarchy among the topics.
A funnel Pyramid Diagram is an inverted form of the pyramid chart type, so the least width is displayed at the bottom while the broadest section is on the top. It is also an equilateral triangle but in the inverted form and includes a nozzle at the tip. It is also divided into several different horizontal sections. However, each section can have extra width and length in a funnel chart. This is based on the significance and size of the topic to be covered in that particular section and can also be tied to specific data values.
A cone Pyramid Diagram is a more general form of a pyramid chart. A pyramid is a cone, but every cone is not a pyramid. Two-dimensional cones and pyramid diagrams look similar. However, in three-dimensional forms, they are pretty different. A cone is made up of a simple closed curve in a plane, creating a conical shape. A cone Pyramid Diagram can be divided into horizontal sections of equal length and varying widths. The width of these sections increases as we move down the cone chart and show the hierarchy.
Here are some different examples of different types of the Pyramid Diagram :
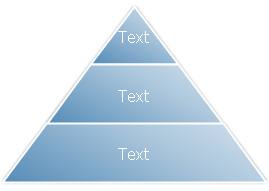
Basic Pyramid Diagram is used to show proportional, interconnected, or hierarchical relationships with the largest component on the bottom and narrowing up. Level 1 text appears in the pyramid segments and Level 2 text appears in shapes alongside each segment.
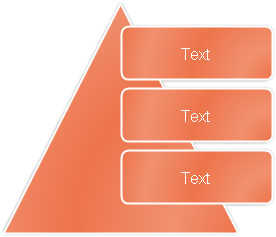
Pyramid List Diagram is used to show proportional, interconnected, or hierarchical relationships. Text appears in the rectangular shapes on top of the pyramid background.
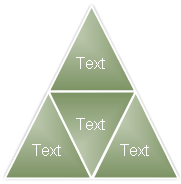
Segmented Pyramid Diagram is used to show containment, proportional, or interconnected relationships. The first nine lines of Level 1 text appear in the triangular shapes. Unused text does not appear, but remains available if you switch layouts. It works best with Level 1 text only.
Part 4: What to Do Before Creating a Pyramid Diagram?
- Always determine a topic. It is always important to have a consensus over a well-thought-out topic the pyramid will be addressing. Write this name prominently to keep it in view to focus.
- Decide subcategories. Write down the subcategories for the primary topic that you chose. Always strive for an optimal number of subcategories, too many subcategories can make your Pyramid Diagram too crowded, and analyzing the trends will be difficult. In comparison, too little can make Pyramid Diagram s non-supportive for classification.
- Determine level and status. Allot a class or grade to each subcategory to decide its placement in the Pyramid Diagram appropriately.
- Determine status. Take the weighted list of the categories and arrange them from most important to least important, smallest to largest, or whatever factor you want to work on.
- Create sections. Divide the pyramid into sections according to the categories you have decided on.
Part 5: How to make Pyramid Diagram in EdrawMax
Step 1: Launch the EDrawMax drawing program.
Step 2: Go to New>Marketing>Pyramid Diagrams .
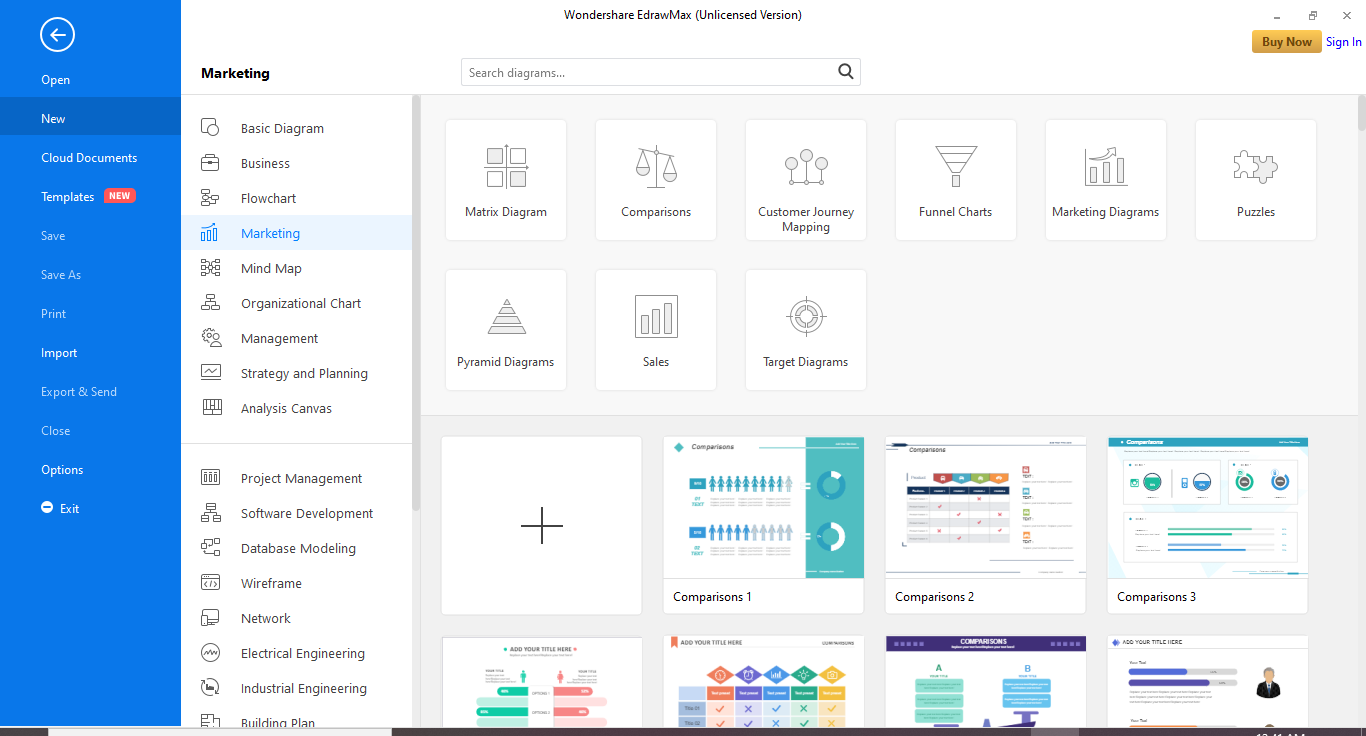
Step 3: If you want to create your pyramid from scratch, click the + tile in the bottom pane. You will see a drawing canvas opened for you with the pyramid shapes and tools in the left pane.
Step 4: Bring a pyramid shape from the Pyramid Shape toolbar on the left-hand side and drop it onto the drawing canvas.
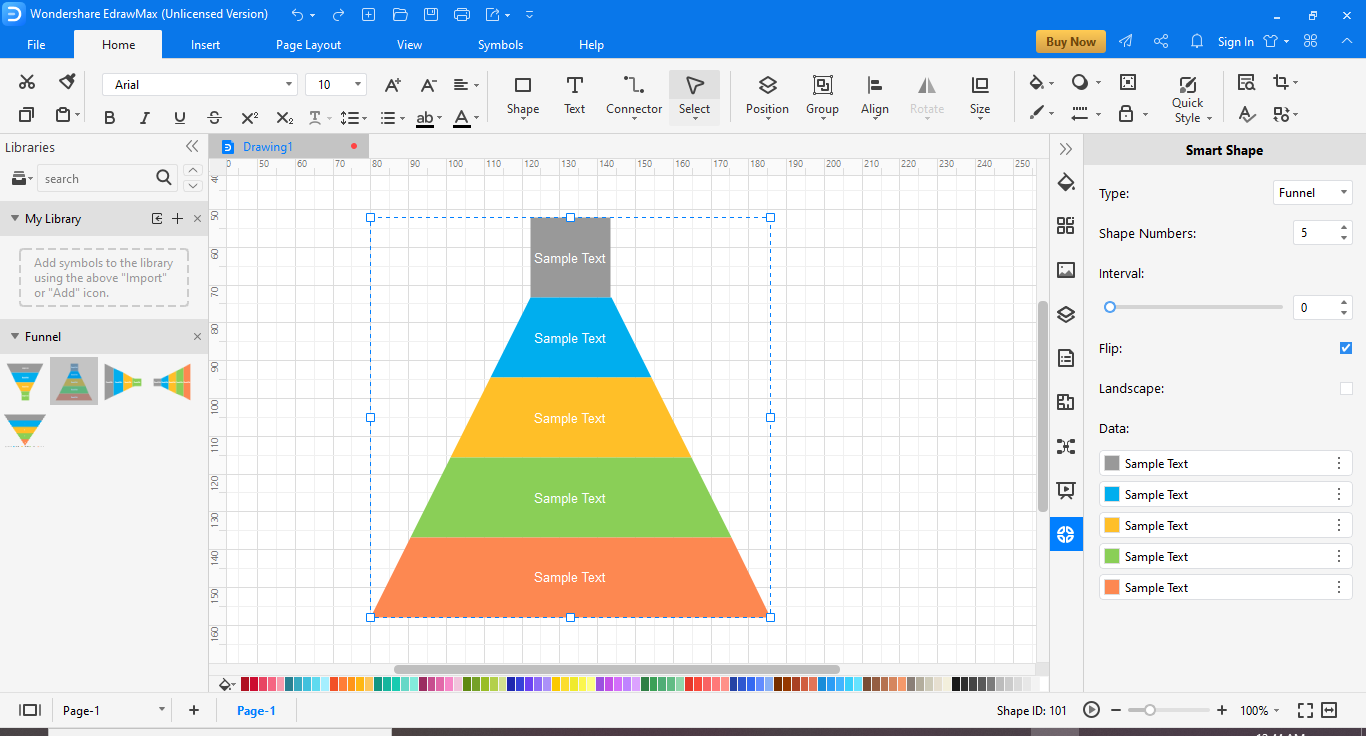
Step 5: You can number the steps, interval, i.e., space between levels, and other details on the right-side pane.
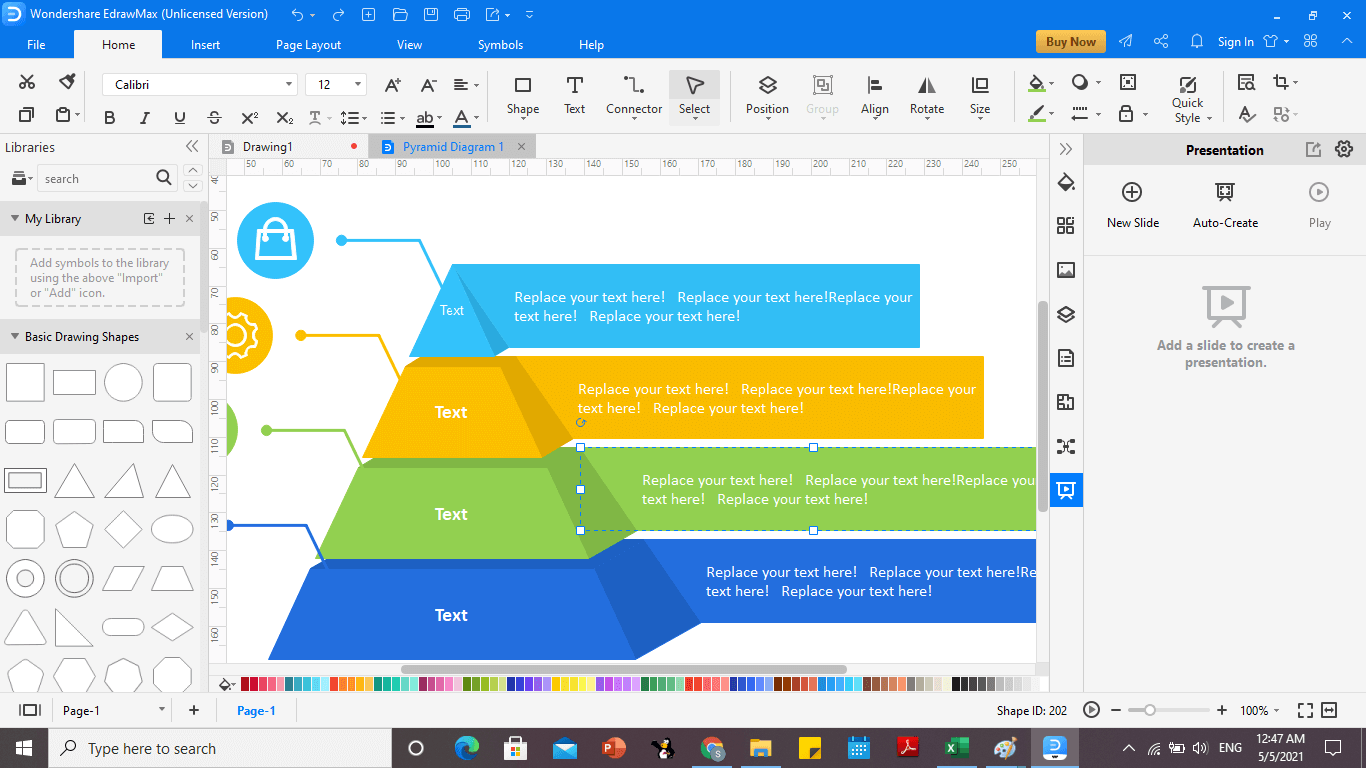
Step 6: Add the labels for the sections by double-clicking.
Step 7: Once you complete your required diagram, you can save it. You also have the option of saving and exporting the document in multiple formats, including HTML, PDF, VISIO, SVG, and many more. This feature is important as it makes the distribution and presentation of Pyramid Diagrams easier.
If you want to use a template, at the step 2, you can select a pre-made template instead of clicking the + tile.

An all-in-one platform for 210+ diagrams.
・ Simple alternative to Visio
・ 26k+ symbols
・ 10K+ free templates
・ 10+ AI diagram generators


Part 6: Tips for making Pyramid Diagram
Make conscious efforts to make your Pyramid Diagram clear, concise, and readable. Pyramid Diagrams are not meant to be a detailed account of any topic. You will not add hundreds of words or visuals to make it crowded. Remember that a Pyramid Diagram is to visualize categories or sections of data and their levels only.
Always label the diagram correctly. Give accurate and precise information in the sections. You can use colors and the width of pyramid sections to add clarity and readability to your chart.
Ensure that you decide on one factor that will affect your hierarchy and place your section in the pyramid accordingly. You cannot use multiple variables for placement anyway.
Good use of templates and graphics can make your Pyramid Diagram easy to read and pleasantly presentable.
Part 7: Examples of Pyramid Diagram

Maslow's hierarchy of needs is probably the most famous Pyramid Diagram . It is a motivational theory based on a five-tier pyramid of human needs. From the bottom of the hierarchy going upwards, the needs are physiological needs, such as food and clothing, safety, love, belonging needs, esteem, and self-actualization.
This Pyramid Diagram shows both the levels and the dependency of class over each other. The needs in the lower sections must be satisfied before individuals can attend to needs higher up.
As with any diagram or planning and management tool, pre-analysis is necessary for a perfect, accurate, and usable chart. It is important to keep all the information in a readable and arranged format before starting the drawing so that the result is free of mistakes.
More Pyramid Chart Resources


