Nassi-Shneiderman Diagram Software
What is a Nassi-Shneiderman Diagram
Nassi-Shneiderman diagrams are an alternative notation for process flowchart. A Nassi-Shneiderman (NS) diagram is a graphical method of stating algorithms. It is a diagrammatic approach to algorithm design but is not as bulky to draw as flowcharts.
NS Diagram Software
Edraw is a very easy-to-use and intuitive database design tool and Nassi-Shneiderman software which can save you hundreds hours of work.
Free Download Nassi-Shneiderman Software and View All Examples
System Requirements
Works on Windows 7, 8, 10, XP, Vista and Citrix
Works on 32 and 64 bit Windows
Works on Mac OS X 10.2 or later
NS Diagram Software Features
|
|
|
|
|
|
|
|
|
|
|
|
|
|
|
|
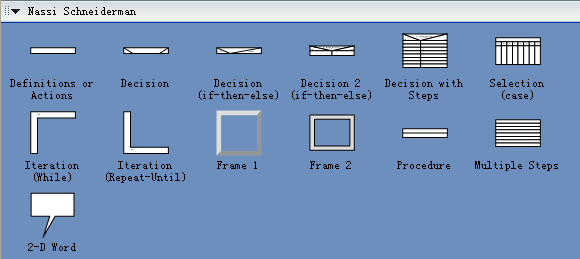
Nassi-Shneiderman Symbols
Edraw contains special shapes and settings for creating Nassi-Shneiderman (NS) diagrams and other structured flowcharts.
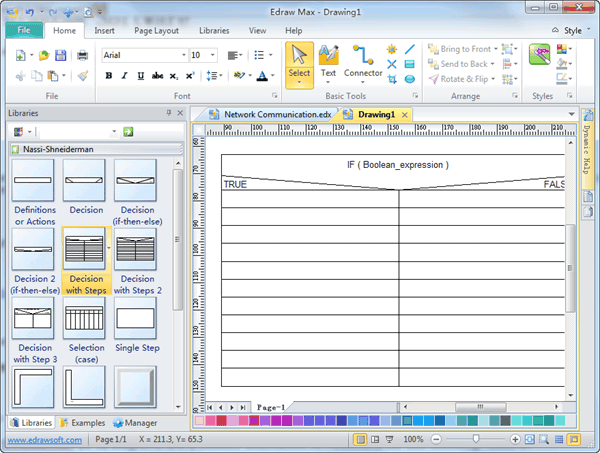
In Edraw Professional, the Nassi-Shneiderman Diagrams template and shapes are in the Software folder.
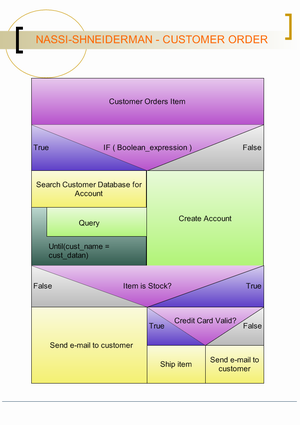
Examples of Nassi-Shneiderman Diagram
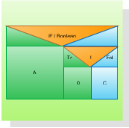
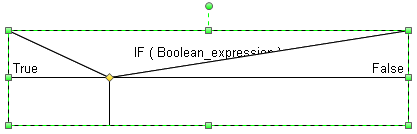
The Nassi-Shneiderman (NS) diagram is a graphical method of stating algorithms. Many people claim that it is very easy to read, especially for beginners. That is probably true but maintaining NS diagrams can be a problem for the program designer. Here is a simple example of a NS diagram:
Some Tips in Drawing Nassi-Shneiderman Diagrams
1. Drag the shapes from the Nassi-Shneiderman templates in the "Software" category.
2. You can move the yellow control point to change the shape.
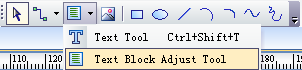
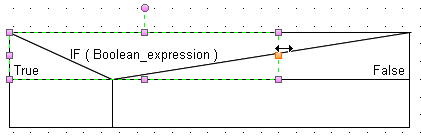
3. Switch the Text Block Adjust Tool, you can change the position of text.
Then click the shape to select the text block. So you can change the geometry of text now.
4. Sometimes you need to close the snap functions in order to align shapes. So you find it at the "Snap & Glue" Dialog in the "Tool" menu.
Nassi-Shneiderman Diagrams
Also known as Chapin Charts, Nassi-Shneiderman (N-S) diagrams are a modern alternative to flowcharts for the following reasons:
- N-S diagrams are an alternative to simple flowchart.
- An N-S diagram can be drawn using text and lines (or completely with ASCII characters).
- N-S diagrams show processing by series, by selection, or by iteration.
- N-S diagrams are read from top to bottom.
- N-S diagrams are more structured than flow charting (one start, one end).


