Cause and Effect Diagram
- Part 1:What is Cause and Effect Diagram
- Part 2: Advantages and Disadvantages of Cause and Effect Diagram
- Part 3: When to Use Cause and Effect Diagram
- Part 4: What to do before creating Cause and Effect Diagram
- Part 5: How to make Cause and Effect Diagram in EdrawMax
- Part 6: Tip for making Cause and Effect Diagram
- Part 7: Example
Part 1: What is Cause and Effect Diagram
A Cause and Effect Diagram is a visual tool to show a list of causes associated with a specific effect. It is one of the seven essential tools of quality and is very popularly used in the field. The cause and effect diagram looks like a fish's skeleton with the fish head to the right of the chart and the bones branching off behind it to the left.
The other name of the cause and effect diagram is the fishbone diagram. It is also called the Ishikawa diagram after Dr. Kaoru Ishikawa, an innovator in quality management.
A cause and effect diagram is used to examine the reasons why something happened or what may happen. It does so by organizing potential causes into smaller categories. It can also show relationships between contributing several factors that are responsible for events.
One of the reasons cause & effect diagrams are also called fishbone diagrams is because the completed Diagram ends up looking like a fish's skeleton with the fish head to the right of the Diagram and the bones branching off behind it to the left.
Part 2: Advantages and Disadvantages of Cause and Effect Diagram
Advantages
- Cause and Effect diagrams help the teams understand the contributing causes of the effect.
- These diagrams visually represent the relationship of the causes and the effect and between each other.
- It is an excellent tool for quality management and improvement.
- The success of the cause and effect diagram is proved in the brainstorming session context also.
Disadvantages
- The problem is composed of a limited number of causes, which are in turn composed of sub causes.
- Distinguishing these causes and sub causes is a useful step to deal with the problem.
Part 3: When to Use Cause and Effect Diagram
The Fishbone diagram could be applied when it is wanted to:
- Focus attention on the causes of one specific issue or problem.
- Focus the team on the causes rather than the symptoms.
- Organize and demonstrate visually the various theories about what the root causes of a problem may be.
- Show the relationship of various factors contributing to a problem.
- Reveal important relationships among various variables and possible causes.
- Provide additional insight into process behaviors.
- Display the sequence of related factors.
- Present the incidence of certain elements.
Part 4: What to do before creating Cause and Effect Diagram
- A brainstorming session is an effective way to identify causes that are related to a problem. It can also be used to divide the reasons into main categories.
- Try to identify the source of every cause or reason.
- You may group them according to different variant factors.
- 6Ms for the manufacturing and production industry are machines, material, method, workforce, and measurement. This mnemonic represents the characteristic dimensions to consider when brainstorming during "cause and effect" problem-solving sessions
- 8 Ps in marketing are price, product or service, promotion, place, personnel or people, packaging, physical evidence, and process. These are again the dimensions to consider for the cause and effect analysis.
- 4 Ss in the service industry are suppliers, surroundings, standard documentation, and systems. When making diagrams for the services industry, you can use these factors for cause identification and categorization.
Part 5: How to make Cause and Effect Diagram in EdrawMax
EdrawMax is a premium drawing software that can be used for making cause-and-effect diagrams. Using this tool makes drawing and editing the Diagram efficient and straightforward. The charts made using EdrawMax have a professional look.
Another significant benefit of using EdrawMax is that the resultant Diagram can be saved and exported in many formats, including JPEG, PowerPoint, PDF, and many more. So the distribution of the document is relatively straightforward.
Let us see the steps involved in making a cause and effect diagram in EdrawMax.
Step 1: Launch the EdrawMax Software

Step 2: Pick a Fishbone Diagram Template
Goto New > Management and click the Cause and Effect Diagram button from the top. Now, choose a preferred fishbone diagram template.

Alternatively, you can use the "+" button to open a new document and start creating your cause and effect diagram from scratch. You will use the symbols in the Symbol Library on the left.
Step 3: Add details to the Diagram
Double-click the text placeholder at the fish mouth. Here you will fill in the problem description. Next, double-click the other text boxes and label the categories and branches with their relevant titles.
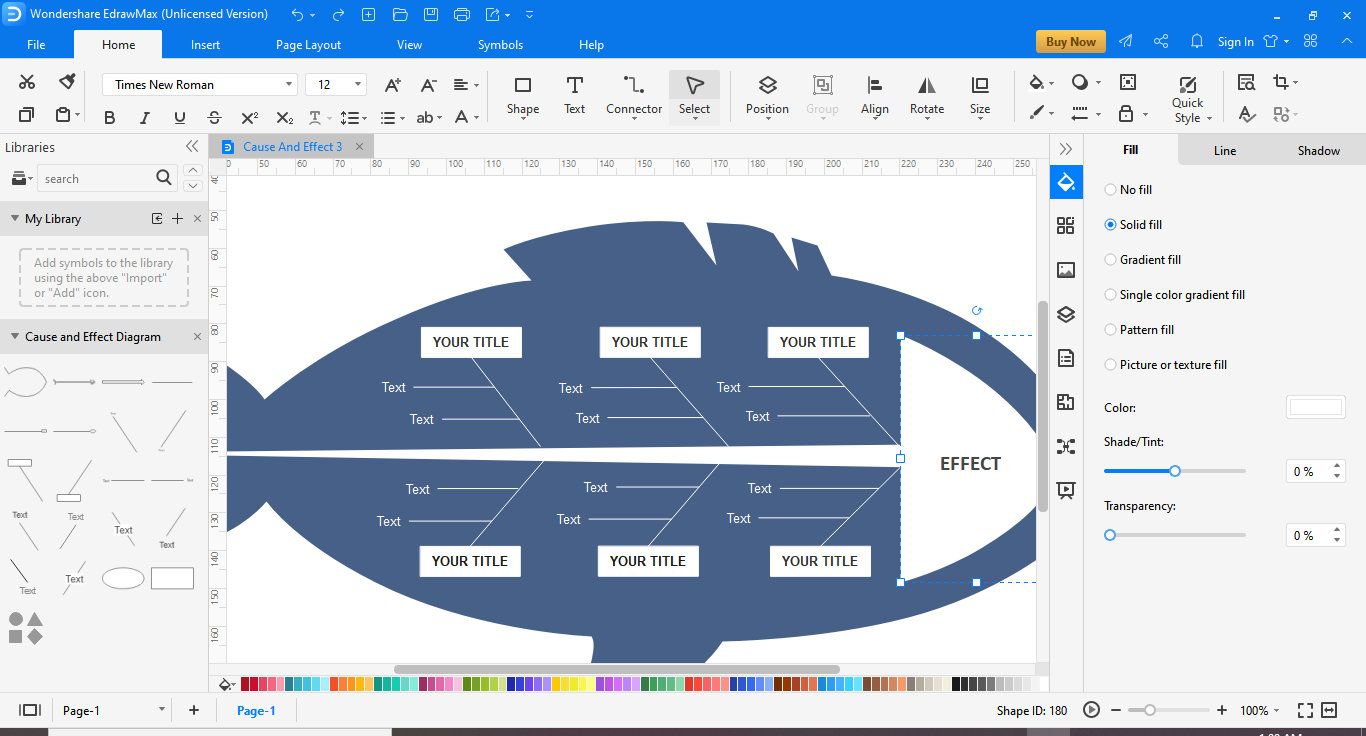
Continue adding more categories and branches. You can double-click an appropriate symbol from the Symbol Library on the left.
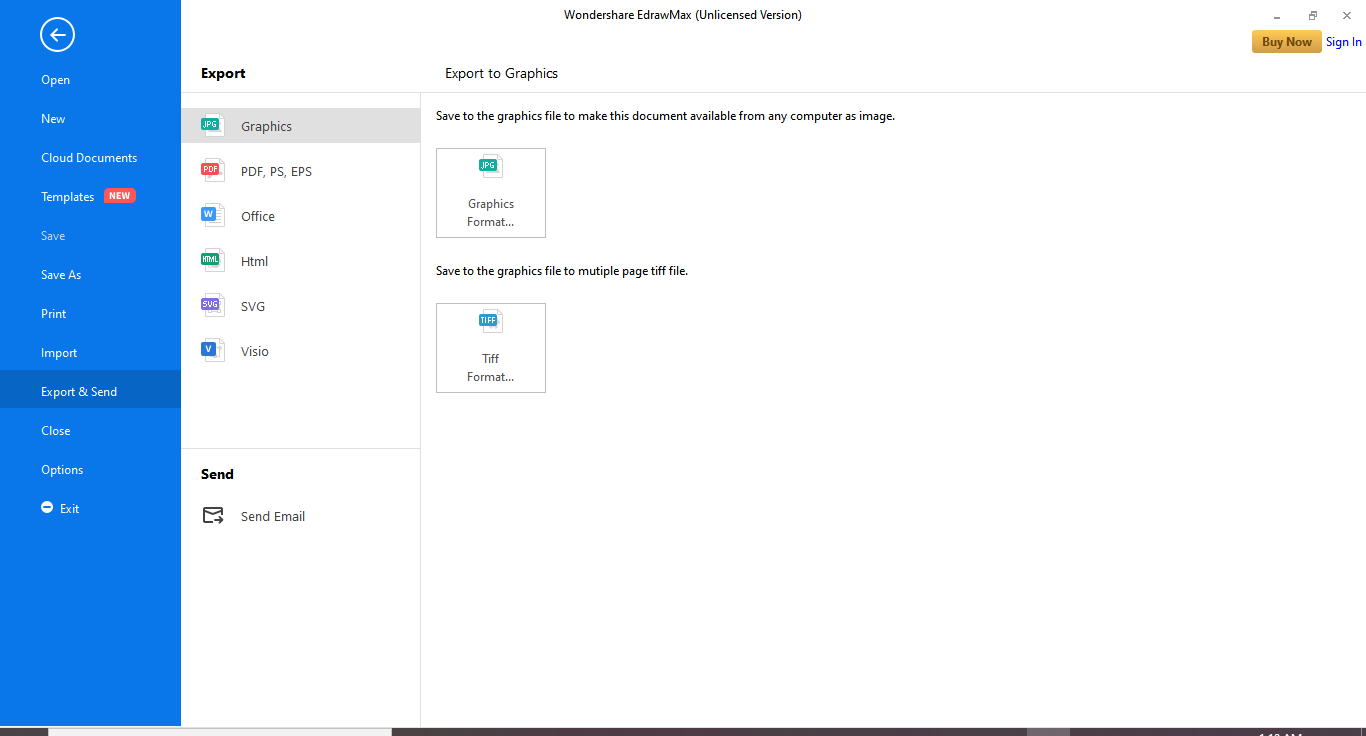
Step 4: Save or Export Your Diagram
Click File from the menu bar at the top, and click Save As or Export to save your Diagram to save or export your Diagram in many available file formats such as a PowerPoint, Word Document, PDF, or Scalable Vector Graphics (SVG).

An all-in-one platform for 210+ diagrams.
・ Simple alternative to Visio
・ 26k+ symbols
・ 10K+ free templates
・ 10+ AI diagram generators


Part 6: Tip for making Cause and Effect Diagram
A cause and effect diagram is a critical quality management tool. Therefore, its effectiveness depends on its accuracy. The best tip for a well-drafted cause and effect diagram is to follow a complete process. The basic steps of the process are;
- Identify the problem
- Brainstorm
- Draw the backbone.
- Causes and effects.
This is the foundation of an adequate cause and effect diagram. When the foundation is correct, the building is vital. Here, you will identify the problem to be examined. It must be made sure that the real problem is recognized rather than just the symptoms.
It is crucial to involve every stakeholder in the solution. The best way is to choose people from all the departments for the brainstorming session. In the brainstorming sessions, make sure to discuss all possible causes and group them into categories.
After the identification of the problem and brainstorming, it is now time to get into action. Now, draw a straight, horizontal line as the backbone of the cause and effect diagram. On the right side, draw a rectangle at the end. Write a brief description of the problem in this rectangle.
Now you will add causes and effects to the Diagram. You will add lines branching off from the main backbone at an angle. At the end of each branch, write the description of the cause.
These are usually one of the main categories discussed above. You can add details related to the cause or effect in the sub-categories branching off further from the main branch. Keep adding attachments and cause and effect till you have exhausted all the options.
Now, you have got a cause and effect diagram ready.
Part 7: Example
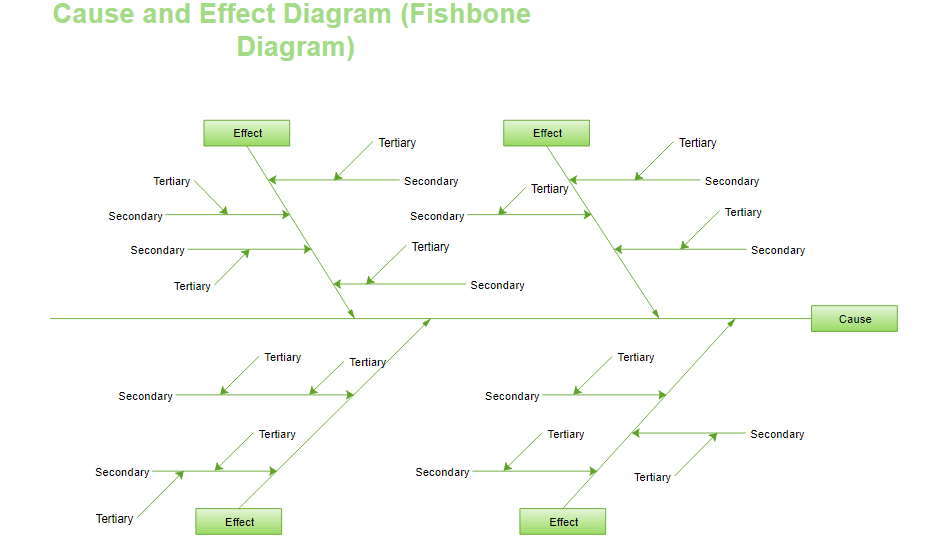
The cause and effect line style diagram is used to identify many potential causes for a problem. There are three types of cause and effect line styles used in this Diagram:
- Secondary cause
- Principal cause
- Tertiary cause
This cause and effect analysis diagram shows the causes of a problem thoroughly, including its possible root causes. The resultant effect is shown as the rectangle at the end of the branch. You can use this Diagram as a blueprint to make your cause and effect diagram according to your specifications and information.


