Create Charts and Graphs on Mac
You begin with smart templates that have been well-formatted. Then you can point and click to edit chart or graph. Add data directly into the attached text boxes and the shapes (bar, column, pie and line etc.) will change automatically. See how to do it with our amazing chart and graph software for Mac easily in the following tutorial.
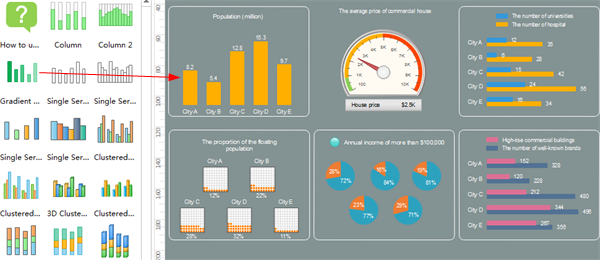
Open a Chart and Graph Template
On the File menu, point to New.-> Click Chart, and then double click the icon of your desired chart, such as bar chart.

A blank canvas and the necessary libraries open automatically.
Add Chart and Graph Shapes
Drag and drop a chart or graph from the left library to the canvas.
Format Chart and Graph Shapes
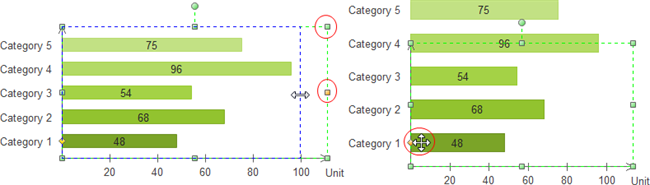
Resize Chart and Graph
Drag the green square handles to resize shapes. Drag the yellow control point to resize subshape.
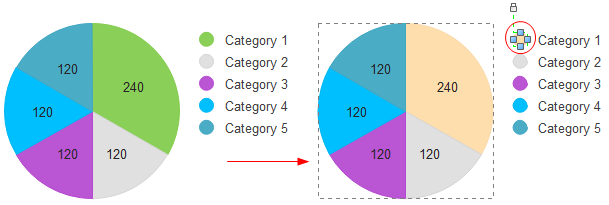
Set Fill Style
Select a series of sub shape in any category or a legend sub shape > Change the selected shape fill style, then Edraw applies the fill style to the series shapes.
Edit Chart and Graph Shapes through Floating Menu
Move the cursor over the chart or graph to show the floating action button. -> Rest the cursor over the floating button. -> Point and click the floating menu to edit the shape such as add a category or hide data label.
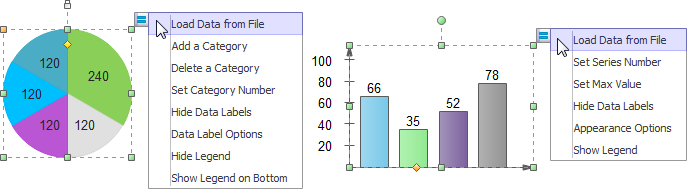
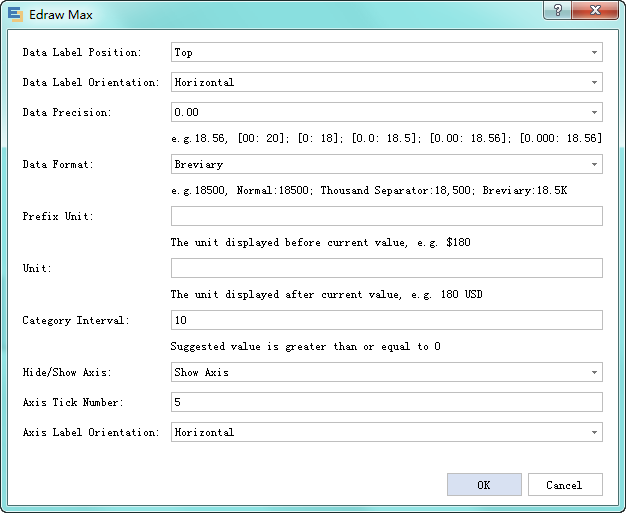
Click the Appearance Options and then a dialogue box pops up. You can format the shape in more aspects in it.
Lay out Chart and Graph
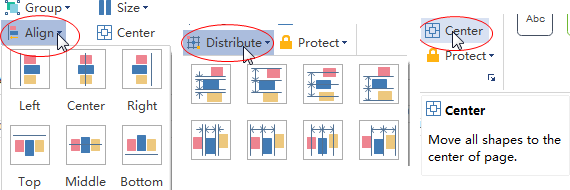
- To align multiple shapes vertically or horizontally, select the shapes you want to align, then, click the Align button under Home tab to align shapes. When moving a shape, the dynamic guidelines show to help you align it with the nearby shapes.
- To distribute three or more shapes at regular intervals, select the shapes, and then, click Distribute in Arrange group under Home tab.
- To locate the whole diagram in the center, click Center in the Arrange group under Home tab.
Add Text to Chart and Graph
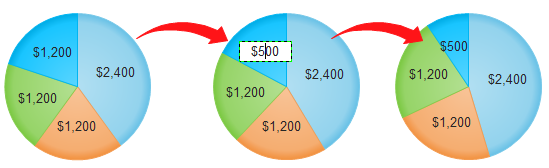
- To add text to a shape, select it, and then type. When you are finished typing, click outside the text box. Our chart and graph shapes are smart vector shapes. After you enter new numbers in the data labels, relevant shapes will change automatically to reflect the data changes.
- Press Ctrl + 2 to add more text boxes. Press Ctrl + shift + 2 to adjust text box.
- Choose a different font under Home tab. Customize the size, color and alignment by clicking relevant menus.
Change Chart and Graph Theme
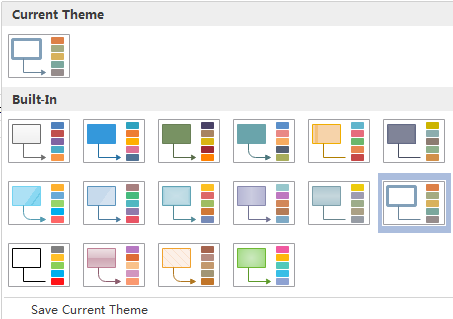
By choosing a suitable Chart and Graph theme, you can add professionally designed fill, line and text style to your chart altogether at 1 click. This saves you lots of troubles in formatting.
Switch to Page Layout tab, select another theme.
Add Background to Chart and Graph
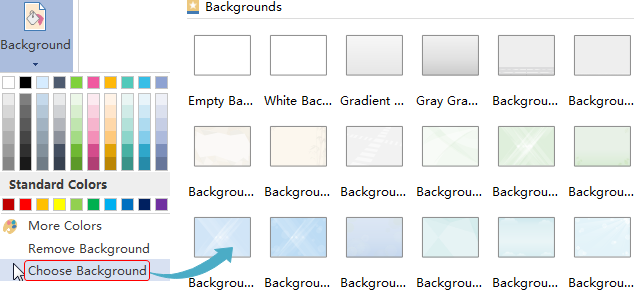
You can add background to make your file more beautiful. Adding your company logo to the background and using this background as master template are also a good way to promote your business. To add a background, go to Page Layout tab and then:
- Click a color for colorful background.
- Click Choose Background to select a predefined background.
- Click Remove Background if you don't want the added background anymore.
- Switch to View tab and then click Background View to edit and personalize the background.
Save or Export Chart and Graph
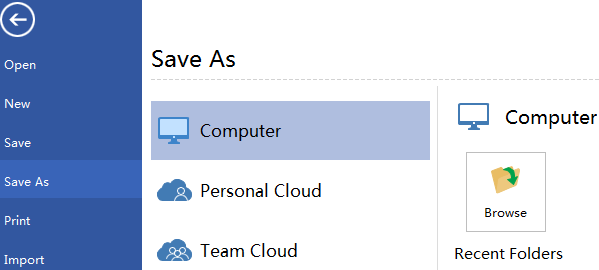
Click Save on File tab to save as the default format. Choose Save as on File tab to save as other formats.
You can choose to save in local files or save in your Cloud. Saving it in Team Cloud can share it with more people.
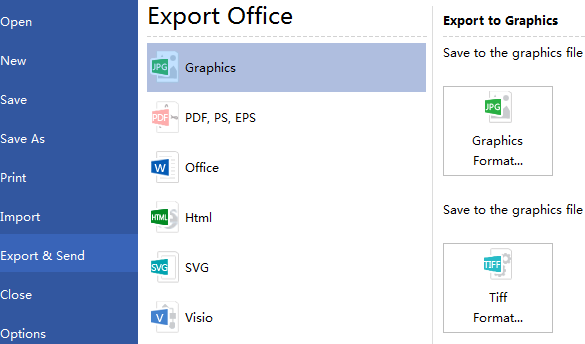
Not everybody has a copy of Edraw so there are times when you need to export diagrams from Edraw into another format. This may be for viewing online within a webpage; for inclusion in another application, such as PowerPoint; or just for printing.
Hit Export & Send under File to export the file as other formats.
Print Chart and Graph
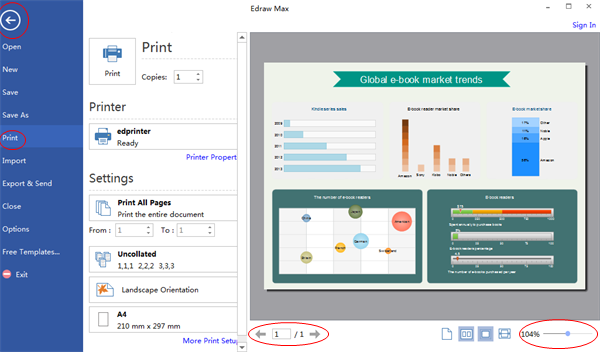
- Click File tab and then choose Print. A preview of your chart automatically shows.
- To view each page, click the arrows below the preview.
- TIP: Use the zoom slider below the preview to magnify the image of the chart.
- To go back to your chart or graph and make changes before you print it, click the top left arrow.
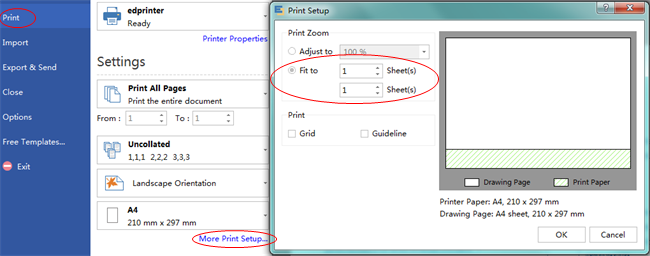
If the canvas is larger than the print paper, the drawing will be printed on more than 1 paper.
To print it on only 1 paper,
click More Print Setup... and then choose Fit to.
Here are some free and fully customizable chart and graph examples. Download them to get inspired and get started quickly.
Further Reading:
How Bar Charts Differ from Pie Charts
Try an easy and effective Chart and Graph tool - Edraw. Download it through the links below.


