How to Create a Gauge Chart Quickly
Part 1: What is a Gauge Chart?
A gauge chart is used to indicate or measure the size of something. A set of values is plotted on a gauge or dial, and a needle points to a value on the gauge. Typically, gauges will have a minimum and maximum zone. The needle will not only indicate the value on the gauge but also how close the value is to the minimum or maximum value.
Gauges are best used in areas or fields where you need to know how close you are to the minimum or maximum value displayed on the gauge. For example, a sales team might use a gauge chart to determine how close they are to meeting their sales targets.

Part 2: How to Make a Gauge Chart
Step 1: Open EdrawMax from your computer, and navigate to [New] > [Graphs and Charts] > [Gauges].
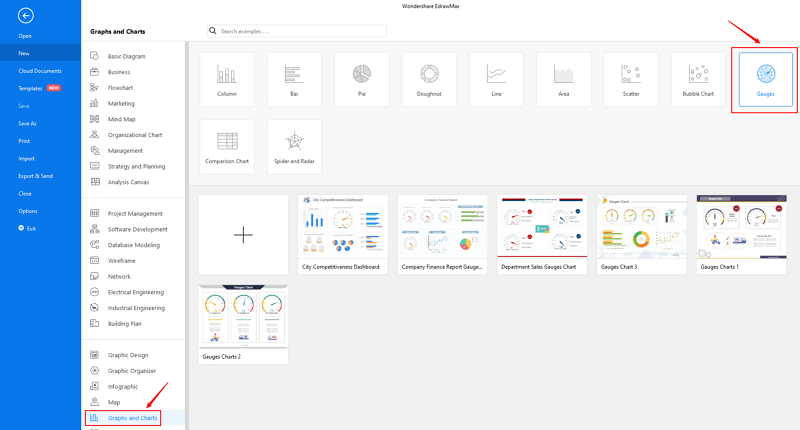
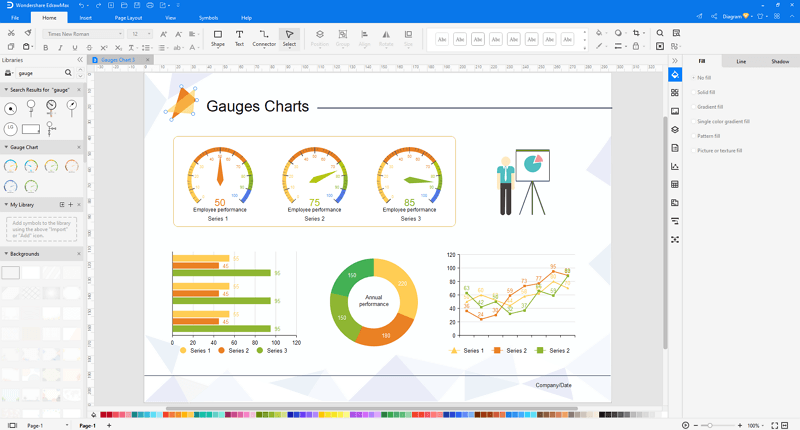
Step 2: Choose a pre-made template from the template gallery and open it. You will see the chart on the canvas with a lot of editing tools on the top menus and right panes.
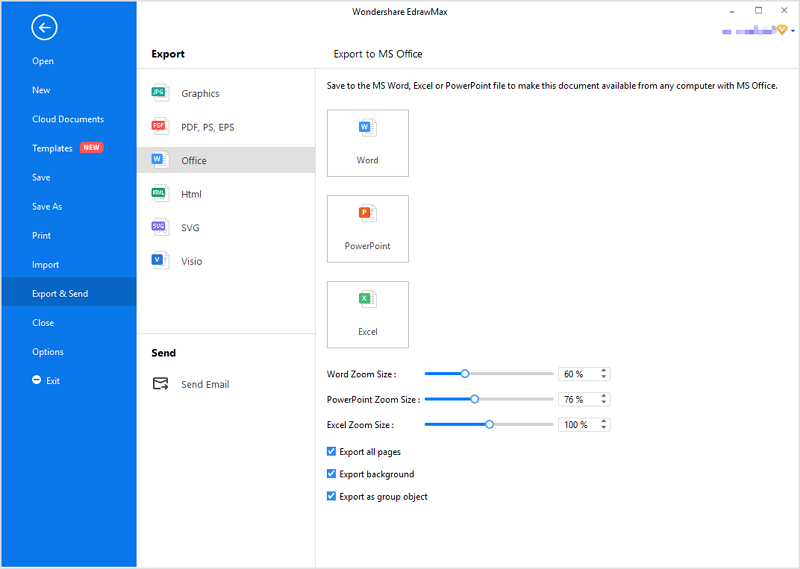
Step 3: You are able to save and export the chart to graphics(JPG, PNG), PDF, editable MS Office file format, SVG and Visio vsdx file format when you finish the design.
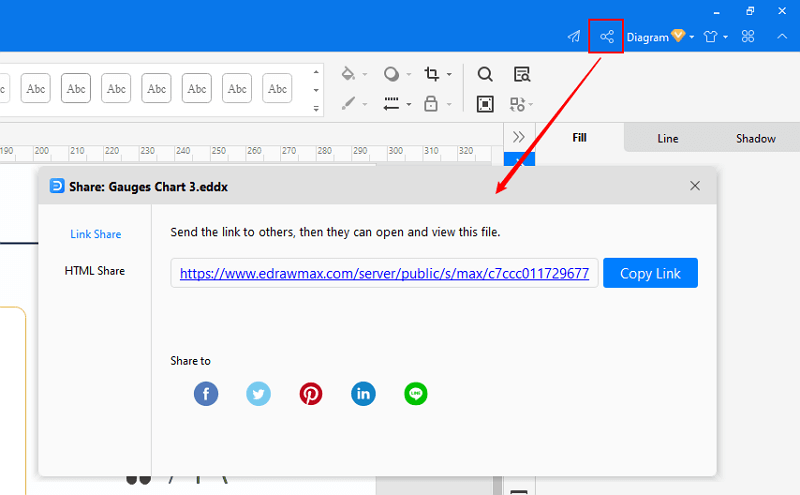
Step 4: You can also share your line chart with others via social media or sharing links. In addition, you can publish your chart into EdrawMax's online template gallery.

An all-in-one platform for 210+ diagrams.
・ Simple alternative to Visio
・ 26k+ symbols
・ 10K+ free templates
・ 10+ AI diagram generators


Part 3: Gauge Chart Examples
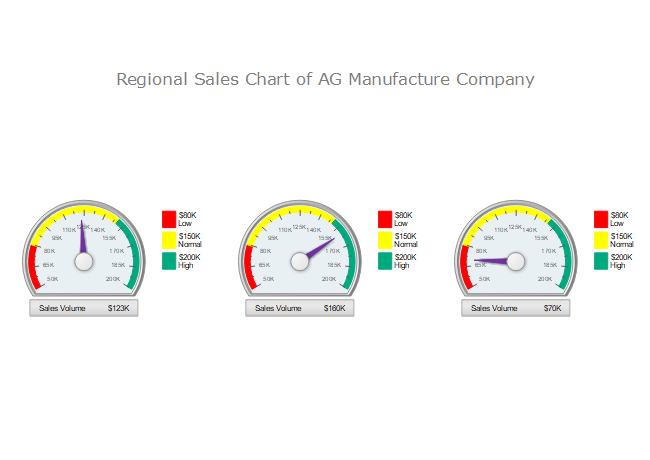
Example 1: Regional Sales Gauge Chart
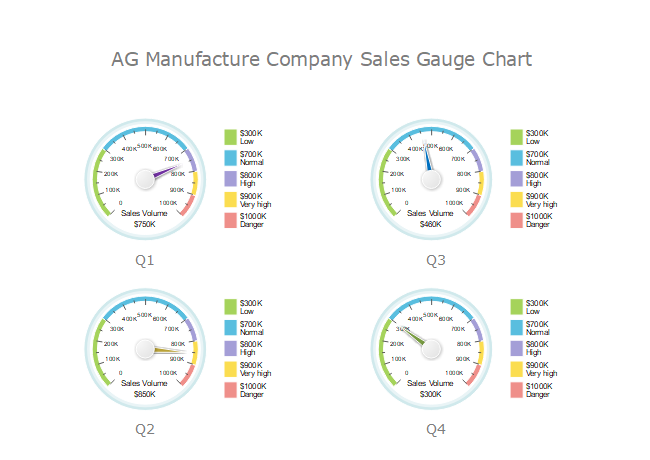
Example 2: Quarter Sales Gauge Chart
More Related


