Venn Examples - 3 Circles
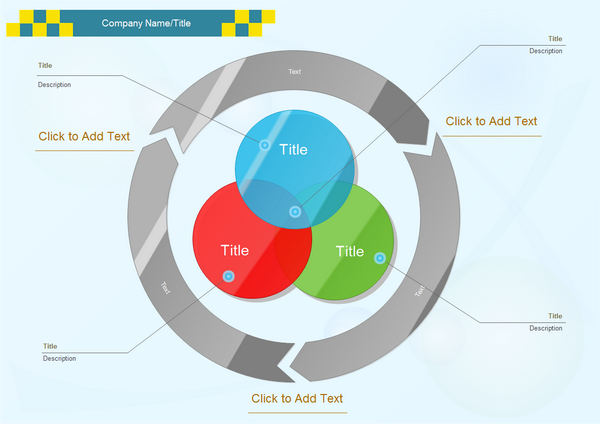
Venn diagrams uses circles to illustrate the logical relationships between groups or sets. They can help you see the similarities and differences between serveral groups or sets. A Venn diagram consists of a collection of simple closed curves, especially circles, whose edges will overlap and each circle usually represents a set.

You can fill the circles with different colors, but the colors need to be highly transparent in order to identify the overlap areas. Besides, you can find many useful templates and shapes of Venn charts both with or without colors in Edraw Max and you can also add tittles, texts and descriptions on the shapes. By using the pre-drawn templates and shapes, you can create a good-looking Venn chart easily and quickly.
Discover why Edraw Max is an excellent program to create Venn diagrams. Try Edraw Max FREE.
Related Diagrams

|

|

|
| Venn chart with 4 circles | Relative Diagram | Venn Analysis Chart |


