How to Create a Bar Chart
Part 1: What is a Bar Chart?
Bar charts display data values in thin, vertical rectangles. The height of each rectangular column is indicative of the value of its category. Bar charts can be used to show positive or negative values. Unlike column charts, values and categories can run along either the horizontal or vertical column. This means that the bars can display data values either horizontally or vertically.
Bar charts are frequently used in education and business settings, especially in areas where only a single value for each category needs to be displayed. It is incredibly simple for any user to read and understand. In addition, the varying heights of the columns make it useful for comparing data sets and categories against each other.
Part 2: Types of Bar Charts
The bar chart is a simple and popular method to visualize data. It shows the comparison of one or more series of data points very effectively. And the clustered bar chart is especially useful in comparing multiple data series.
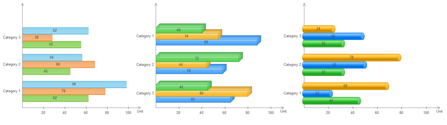
Clustered bar and 3D clustered bar
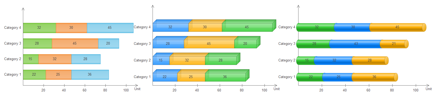
Stacked bar and 3D stacked bar
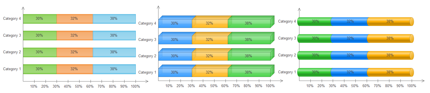
100% stacked bar and 3D 100% stacked bar
Part 3: How to Create a Bar Chart
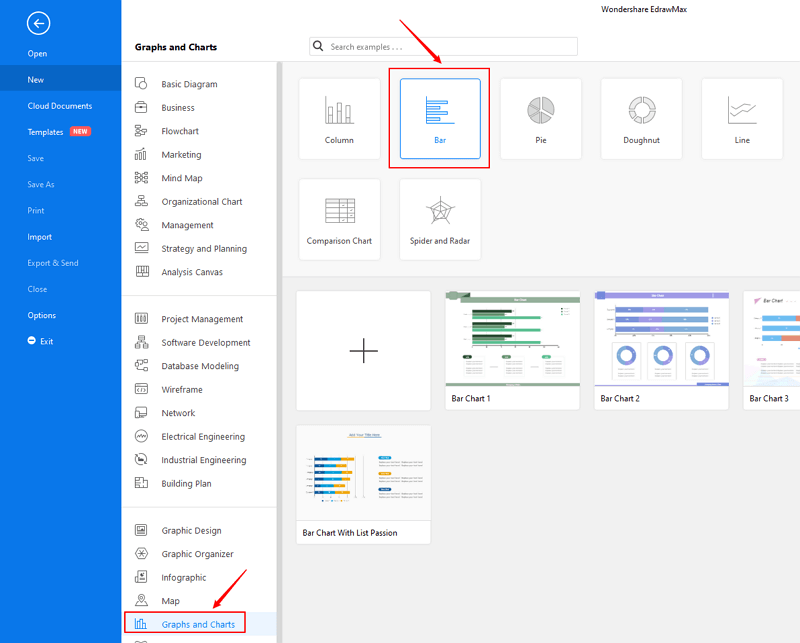
Step 1: Open EdrawMax from your computer, and navigate to [New] > [Graphs and Charts] > [Bar].
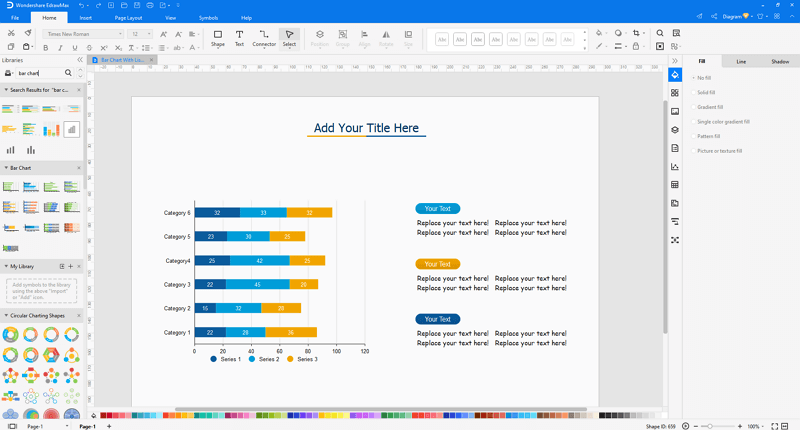
Step 2.1: Choose a pre-made template from the template gallery and open it. You will see the chart on the canvas with a lot of editing tools on the top menus and right panes.
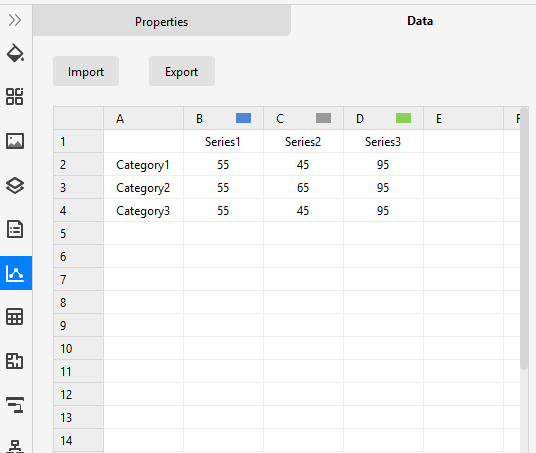
Step 2.2: After you open a blank bar chart template or insert one on the canvas, you can import the data by uploading files (XLSX or CSV) or pasting the data on the windows.
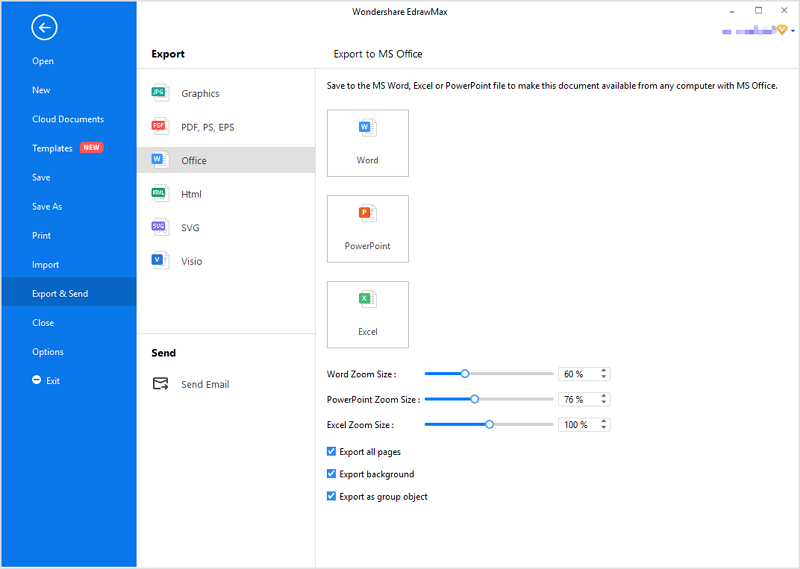
Step 3: When the column chart is finished, you are able to save and export the creation to graphics(JPG, PNG), PDF, editable MS Office file format, SVG and Visio vsdx file format.
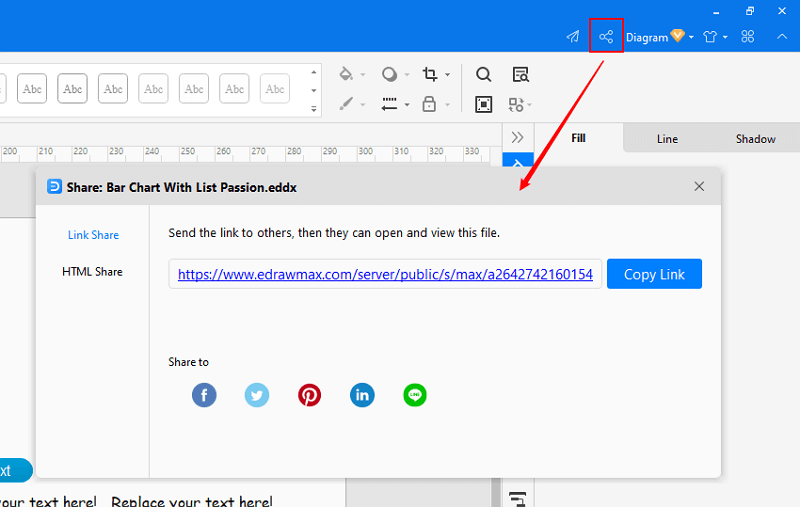
Step 4: Alternatively, you can share the chart via social media and sharing links. In addition, you can publish your diagram into EdrawMax's online template gallery.

An all-in-one platform for 210+ diagrams.
・ Simple alternative to Visio
・ 26k+ symbols
・ 10K+ free templates
・ 10+ AI diagram generators


Part 4: Bar Chart Examples
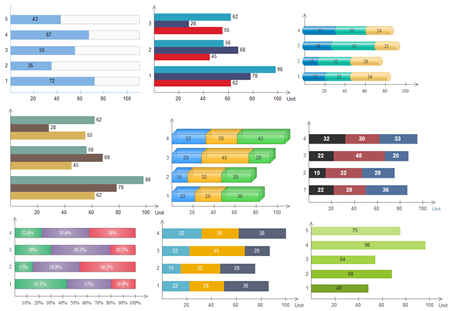
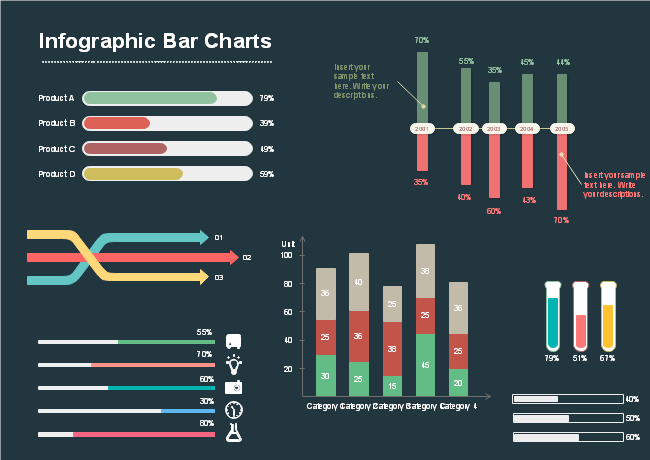
Example 1: Infographic Bar Charts
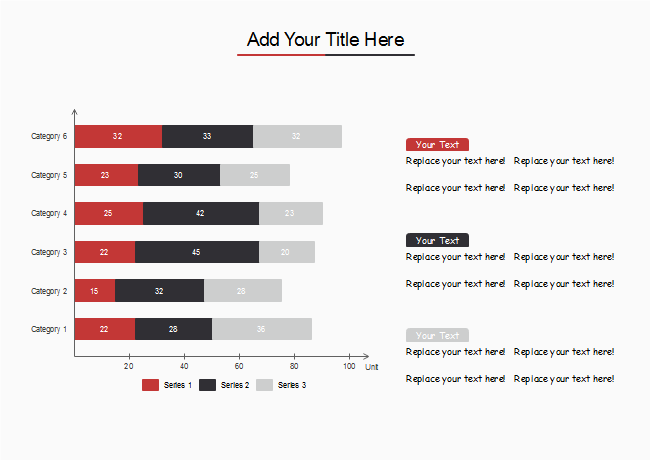
Example 2: Stacked Bar Chart
More Related


