How to Create a Bubble Chart
Part 1: What is a Bubble Chart?
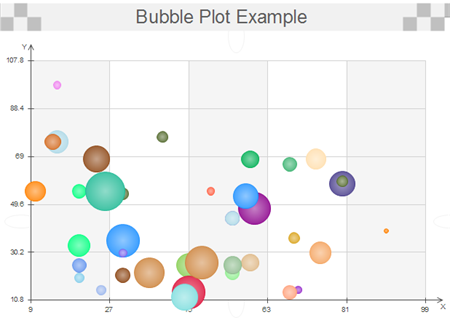
Bubble charts are used to compare the relationship between variables in three different dimensions. Similar to scatter plots, x and y values should be plotted. However, instead of a dot, a large circle or disk will be used instead. The size of the disk will represent the third variable to be compared.
Bubble charts are considered to be an extension of scatter plots. They are both useful for identifying trends in sets of data and for spotting anomalies. They aid in data analysis. For example, if a cluster of disks is found near each other, it may reflect a certain trend or pattern. Because they can depict an extra dimension, statisticians and economists may find them to be more useful when it comes to studying social, political, and economic relationships.
Part 2: How to Create a Bubble Chart
Step 1: Open EdrawMax from your computer, and navigate to [New] > [Graphs and Charts] > [Bubble Chart].
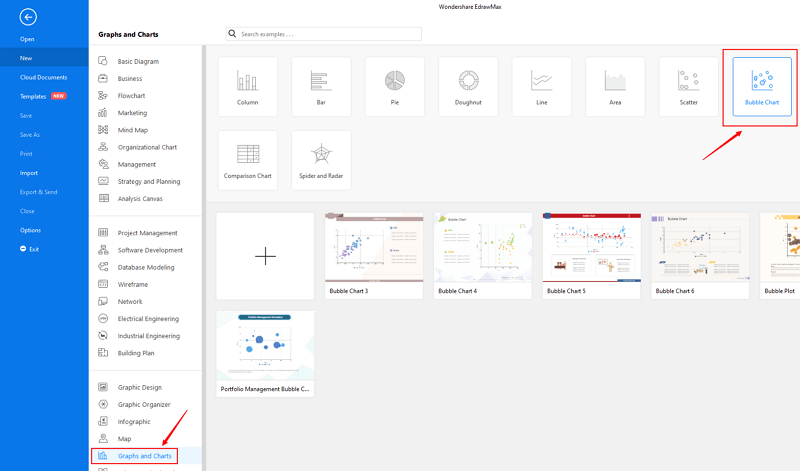
Step 2.1: Choose a pre-made template from the template gallery and open it. You will see the chart on the canvas with a lot of editing tools on the top menus and right panes.
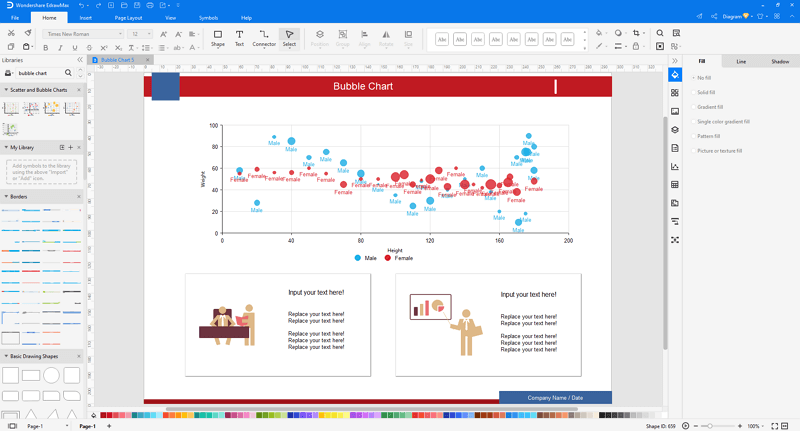
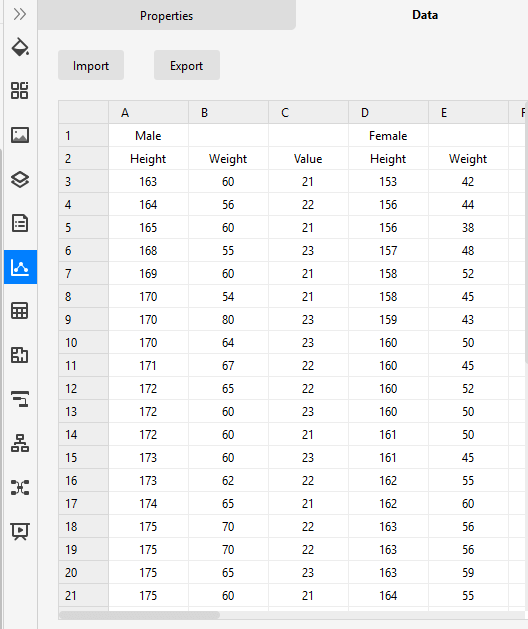
Step 2.2: After you open a blank bubble chart template or insert one on the canvas, you can import the data by uploading files (XLSX or CSV) or pasting the data on the windows.
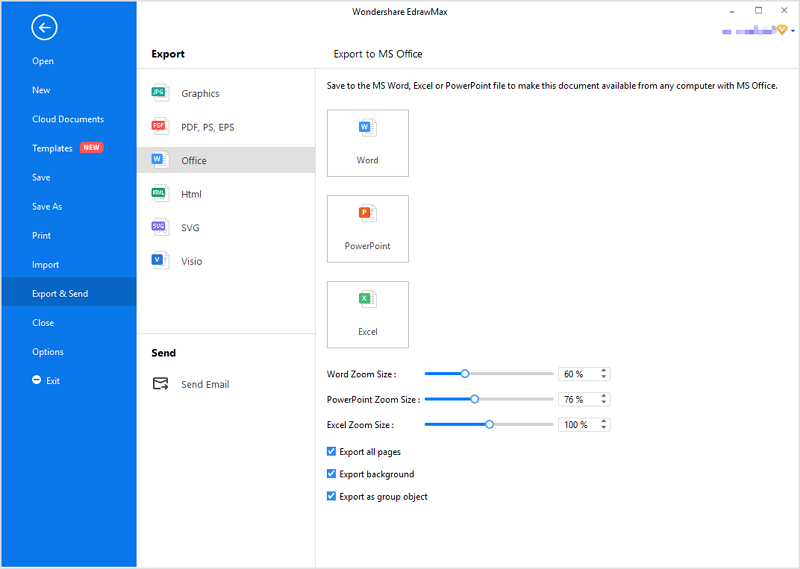
Step 3: When the column chart is finished, you are able to save and export the creation to graphics(JPG, PNG), PDF, editable MS Office file format, SVG and Visio vsdx file format.
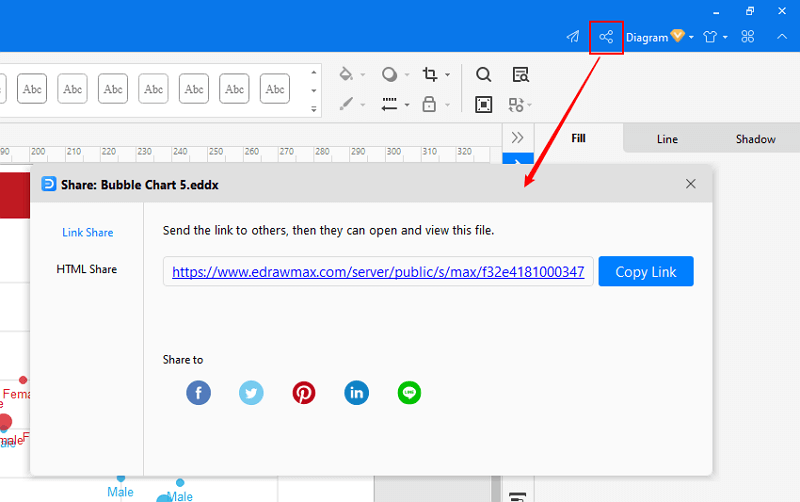
Step 4: Alternatively, you can share the chart via social media and sharing links. In addition, you can publish your diagram into EdrawMax's online template gallery.

An all-in-one platform for 210+ diagrams.
・ Simple alternative to Visio
・ 26k+ symbols
・ 10K+ free templates
・ 10+ AI diagram generators


Part 3: Bubble Chart Examples
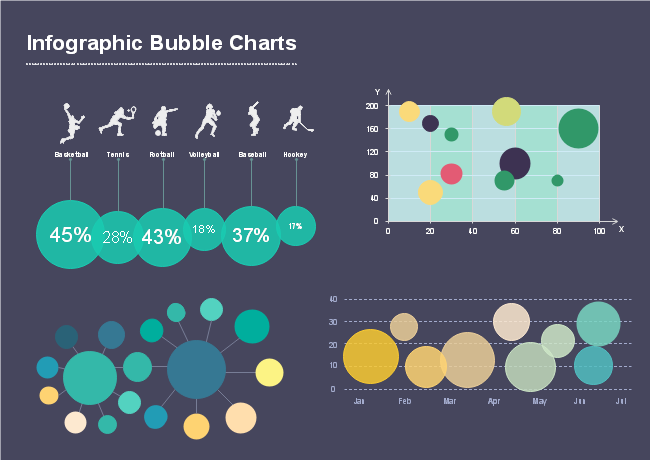
Example 1: Infographic Bubble Charts
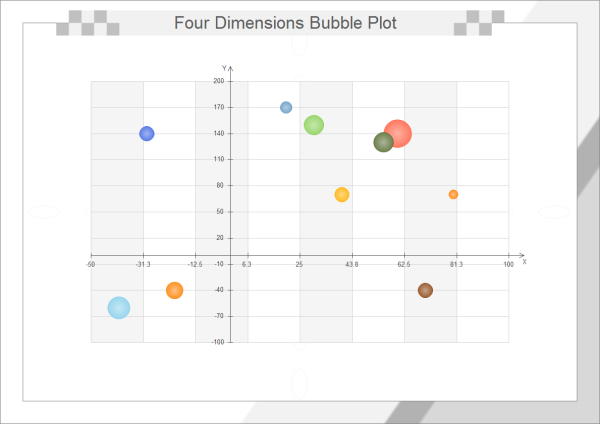
Example 2: Four Dimensions Bubble Plot
More Related


