Bubble Plot Maker
Create excellent bubble plots for free with easy-to-edit templates and spreadsheet editor.
Trusted By Over 25 Million Users & Leading Brands


Why EdrawMax to Make Your Bubble Plots?
Bubble charts for every need
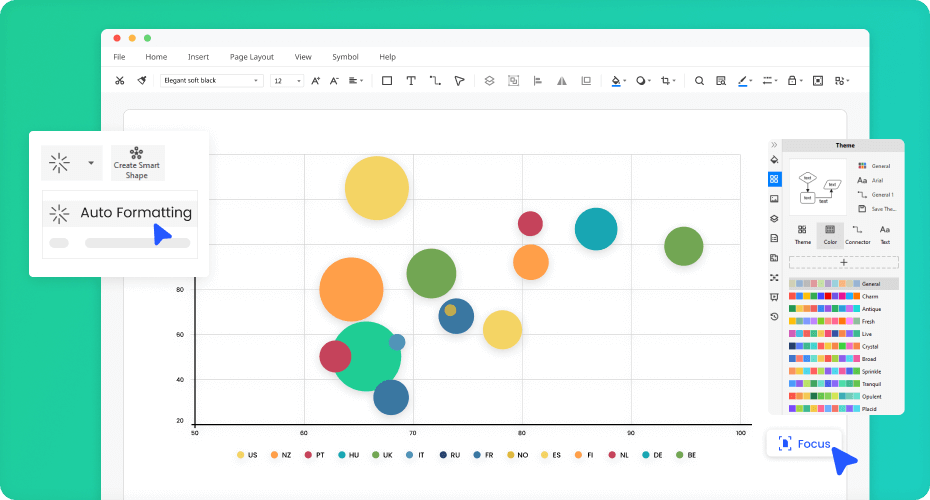
Creating bubble charts is a breeze
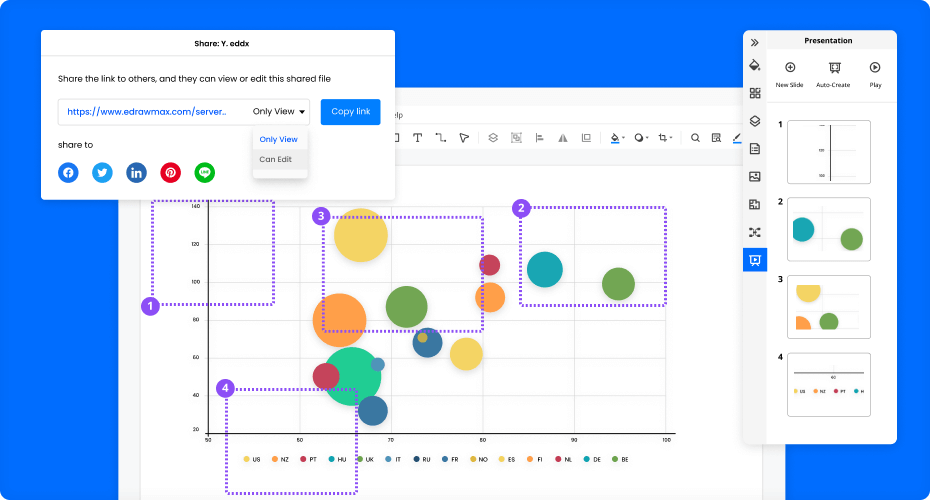
Store and share extremely easy
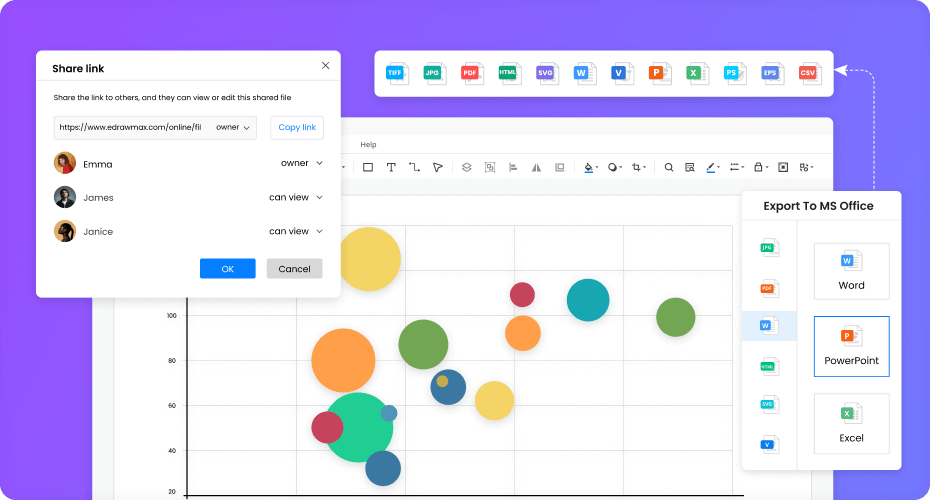
Print, embed, and present without limit
More Features Of Bubble Plot Maker
Visio files import and export
Customized fonts and shapes
Insert images and attachments
Infinitive canvas
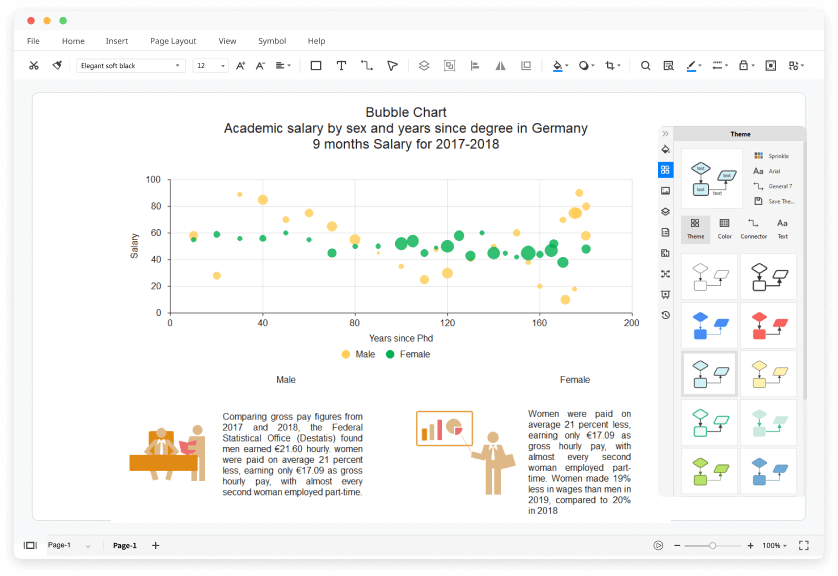
Various color theme
File encryption and file backup
How to Make a Bubble Plot?
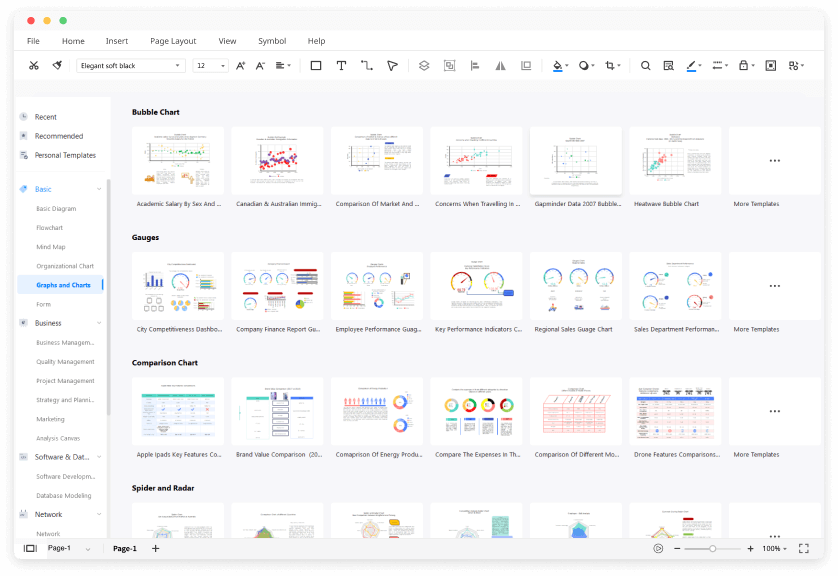
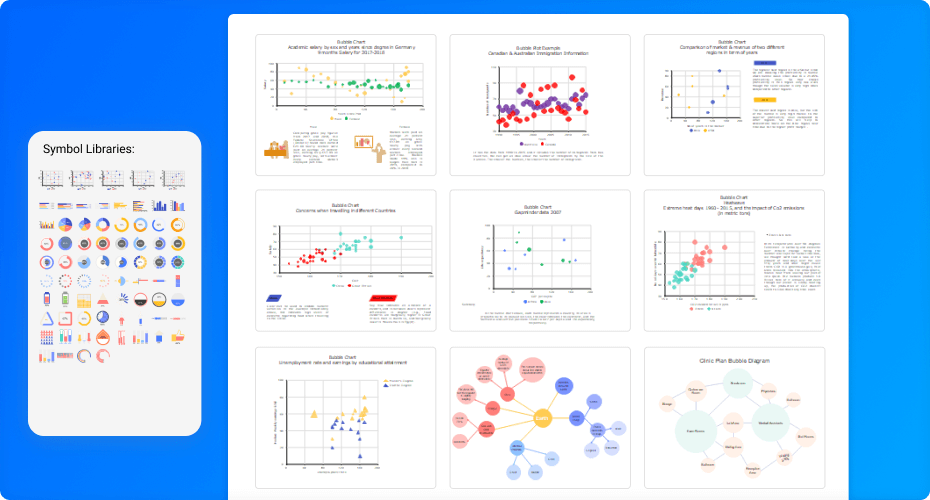
Edraw Bubble Plot Templates
Bubble Plot
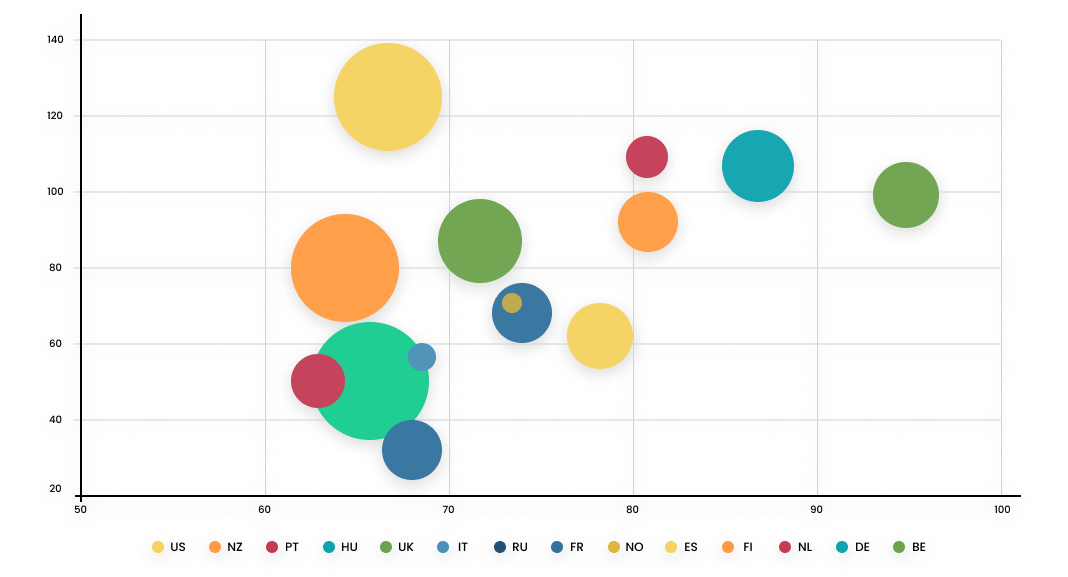
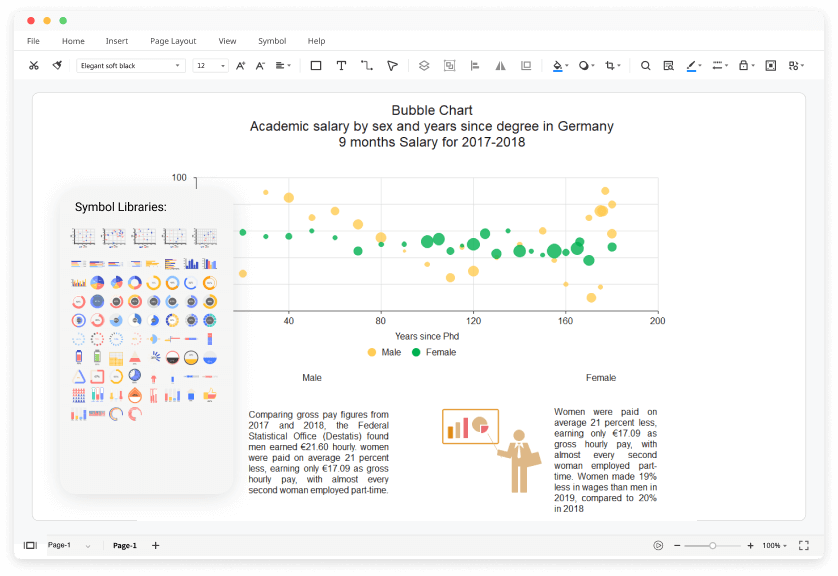
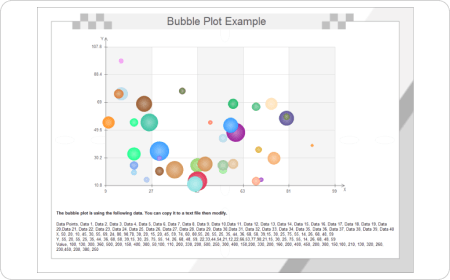
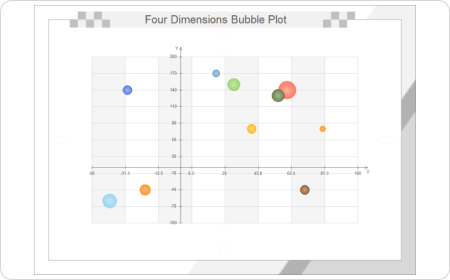
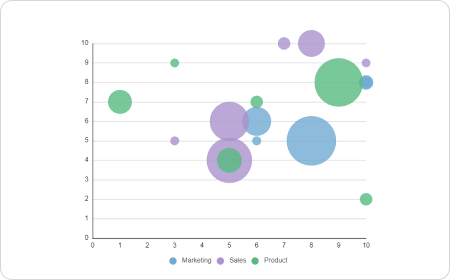
The bubble plot is a great way to display a lot of data. It is especially useful when you have many points, and you want to see which ones are most important.
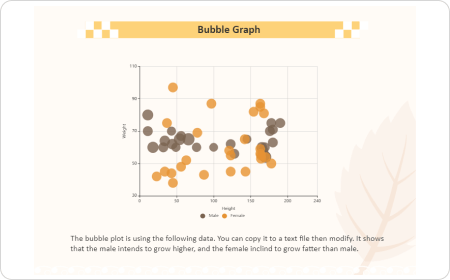
Bubble Graph
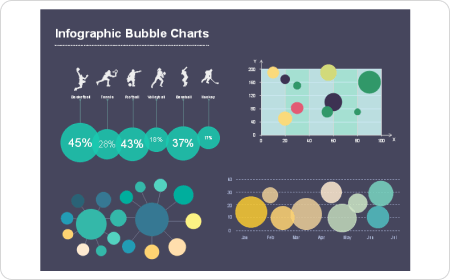
A bubble graph is a variation of the bubble chart. It displays a bar chart with bubbles instead of the bars.
Bubble Chart Example
The best thing about EdrawMax is that it allows you to create a new chart type from scratch with the help of bubble chart example templates.
Bubble Graph Excel
This bubble graph is a template that is compatible with the latest version of Excel. It has a basic design with a few modifications.
PowerPoint Bubble Chart
The PowerPoint bubble chart is a simple and basic bubble chart template that can be used to display data.
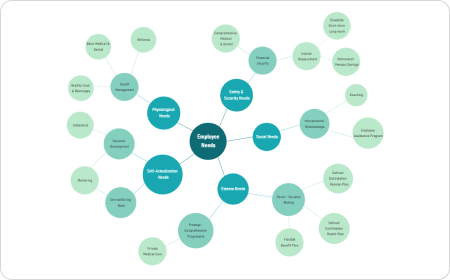
Bubble Flow Chart
It is a variation of a bubble chart where you can see the progression of a process. It is a special type of chart where the bubbles are organized into a flow.
Bubble Plot FAQs

Does EdrawMax have any free bubble plot templates?
Except for the pre-made bubble plot templates in EdrawMax, you can download and customize templates from our Template Community. All the community-made templates are free to use for Edrawers.
How can I share my bubble plots with others who don't use EdrawMax?
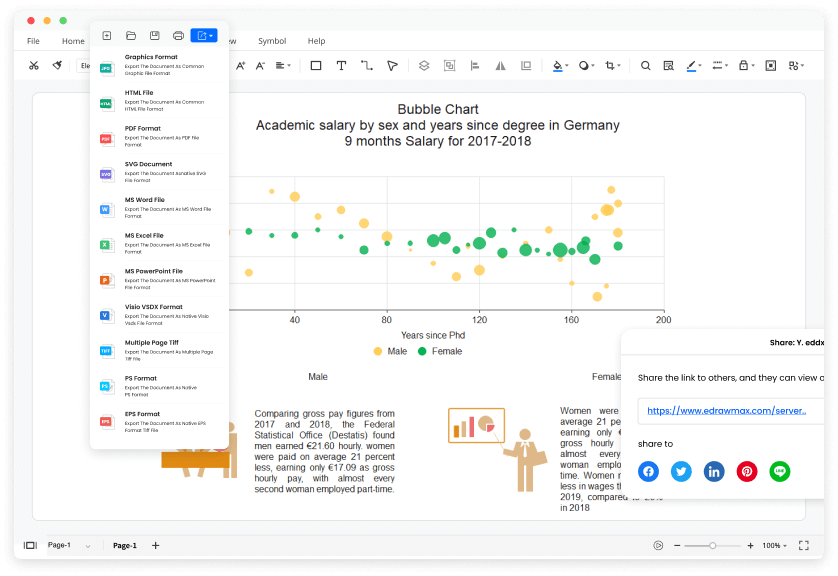
When your bubble plot is complete, you can post it on social media, publish on Edraw Template Community, or export the file as Word, Excel, PowerPoint, Visio, PDF, SVG, PNG and JPG. EdrawMax is dedicated to delivering a superior user experience.
How can I find bubble plot symbols that I need?
No worries. You can find bubble plot symbols by opening and searching in the preset symbol libraries of EdrawMax.
How can I create a bubble plot from scratch?
You can create a bubble plot from scratch by dragging and dropping symbols from the libraries and customizing colors, fonts, lines, etc. All the symbols in EdrawMax are vector, editable, and catered to different types of bubble plots.
Is EdrawMax's bubble plot maker free?
YES! It is free to create different bubble plots in EdrawMax. There are free templates, symbols, and easy-to-use editing tools for making bubble plots. Just download it and try EdrawMax now. You will love it right now.
More Resources
Unlock your diagram possibilities by exploring more diagram makers here.
Find more ideas, tips and knowledge to help create bubble plots.
Need help? Find the instruction or contact support here.
