How to Draw Data Flow Diagrams
What is Data Flow Diagram
Data flow diagrams illustrate how data is processed by a system in terms of inputs and outputs.
Data flow diagrams can be used to provide a clear representation of any business function. The technique starts with an overall picture of the business and continues by analyzing each of the functional areas of interest. This analysis can be carried out in precisely the level of detail required. The technique exploits a method called top-down expansion to conduct the analysis in a targeted way.
As the name suggests, Data Flow Diagram (DFD) is an illustration that explicates the passage of information in a process. A DFD can be easily drawn using simple symbols. Additionally, complicated processes can be easily automated by creating DFDs using easy-to-use, free downloadable diagramming tools. A DFD is a model for constructing and analyzing information processes. DFD illustrates the flow of information in a process depending upon the inputs and outputs. A DFD can also be referred to as a Process Model. A DFD demonstrates business or technical process with the support of the outside data saved, plus the data flowing from the process to another and the end results.
Data Flow Diagrams Symbols
There are some symbols that are used in the drawing of business process diagrams (data flow diagrams). These are now elaborated, together with the rules that apply to them.
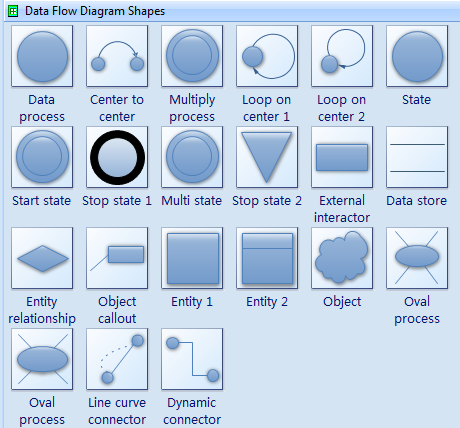
Free Download Diagram Software and View All Examples
Process
The process shape represents a task that handles data within the application. The task may process the data or perform an action based on the data.
Multiple Process
The multiple process shape is used to present a collection of sub processes. The multiple process can be broken down into its sub processes in another DFD.
External Entity
The external entity shape is used to represent any entity outside the application that interacts with the application via an entry point.
Data Flow
The data flow shape represents data movement within the application. The direction of the data movement is represented by the arrow.
Data Store
The data store shape is used to represent locations where data is stored. Data stores do not modify the data, they only store data.
Privilege Boundary
The privilege boundary shape is used to represent the change of privilege levels as the data flows through the application.
Data Flow Diagrams - Context Diagrams
The context diagram represents the entire system under investigation. This diagram should be drawn first, and used to clarify and agree the scope of the investigation.
The components of a context diagram are clearly shown on this screen. The system under investigation is represented as a single process, connected to external entities by data flows and resource flows.
The context diagram clearly shows the interfaces between the system under investigation and the external entities with which it communicates. Therefore, whilst it is often conceptually trivial, a context diagram serves to focus attention on the system boundary and can help in clarifying the precise scope of the analysis.
The context diagram shown on this screen represents a book lending library. The library receives details of books, and orders books from one or more book suppliers.
Books may be reserved and borrowed by members of the public, who are required to give a borrower number. The library will notify borrowers when a reserved book becomes available or when a borrowed book becomes overdue.
In addition to supplying books, a book supplier will furnish details of specific books in response to library enquiries.
Note, that communications involving external entities are only included where they involve the 'system' process. Whilst a book supplier would communicate with various agencies, for example, publishers and other suppliers - these data flow are remote from the 'system' process and so this is not included on the context diagram.
Data Flow Diagrams - Context Diagram Guidelines
Firstly, draw and name a single process box that represents the entire system.
Next, identify and add the external entities that communicate directly with the process box. Do this by considering origin and destination of the resource flows and data flows.
Finally, add the resource flows and data flows to the diagram.
In drawing the context diagram you should only be concerned with the most important information flows. These will be concerned with issues such as: how orders are received and checked, with providing good customer service and with the paying of invoices. Remember that no business process diagram is the definitive solution - there is no absolute right or wrong.
Data Flow Diagrams - Level 1 Diagrams
The level 1 diagram shows the main functional areas of the system under investigation. As with the context diagram, any system under investigation should be represented by only one level 1 diagram.
There is no formula that can be applied in deciding what is, and what is not, a level 1 process. Level 1 processes should describe only the main functional areas of the system, and you should avoid the temptation of including lower level processes on this diagram. As a general rule no business process diagram should contain more than 12 process boxes.
The level 1 diagram is surrounded by the outline of a process box that represents the boundaries of the system. Because the level 1 diagram depicts the whole of the system under investigation, it can be difficult to know where to start.
There are three different methods, which provide a practical way to start the analysis. These are explained in the following section and any one of them, or a combination, may prove to be the most helpful in any given investigation.
There are three different methods, which provide a practical way to start the analysis. These are introduced below and any one of them, or a combination, may prove to be the most helpful in any given investigation:
Data Flow Diagrams - Resource Flow Analysis
Resource flow analysis may be a useful method for starting the analysis if the current system consists largely of the flow of goods, as this approach concentrates on following the flow of physical objects.
Resource flow analysis may be a useful method for developing diagrams if the current system consists largely of the flow of goods. Physical resources are traced from when they arrive within the boundaries of the system, through the points at which some action occurs, to their exit from the system. The rationale behind this method is that information will normally flow around the same paths as the physical objects.
Data Flow Diagrams - Organizational Structure Analysis
The organizational structure approach starts from an analysis of the main roles that exist within the organization, rather than the goods or information that is flowing around the system.
Identification of the key processes results from looking at the organizational structure and deciding which functional areas are relevant to the current investigation. By looking at these areas in more detail, and analyzing what staff actually do, discrete processes can be identified.
Starting with these processes, the information flows between them and between these processes and external entities are then identified and added to the diagram.
Data Flow Diagrams - Document Flow Analysis
The document flow analysis approach is appropriate if the part of the business under investigation consists principally of flows of information in the form of documents or computer input and output.
Document flow analysis is particularly useful where information flows are of special interest. The first step is to list the major documents and their sources and recipients. This is followed by the identification of other major information flows such as telephone and computer transactions. Once the document flow diagram has been drawn the system boundary should be added.
Data Flow Diagrams - Numbering Rules
The process boxes on the level 1 diagram should be numbered arbitrarily, so that no priority is implied. Even where data from one process flows directly into another process, this does not necessarily mean that the first one has to finish before the second one can begin.
Therefore the processes on a level 1 diagram could be re-numbered without affecting the meaning of the diagram. This is true within any business process diagram - as these diagrams do not imply time, sequence or repetition.
However, as the analysis continues beyond level 1 it is important that a strict numbering convention is followed. The processes on level 2 diagrams must indicate their parent process within the level 1 diagram. This convention should continue through level 3 diagrams, and beyond, should that level of analysis ever be required.
The diagram on this screen clearly illustrates how processes on lower level diagrams identify their ancestral path.
Relative Resource


