What is an Organizational Chart
- Part 1: What is an Organizational Chart?
- Part 2: History of Organizational Chart
- Part 3: Advantages and Disadvantage of Organizational Chart
- Part 4: Use Case of Organizational Chart
- Part 5: Types of Organizational Chart
- Part 6: Common Symbols/Element
- Part 7: Tips for Organizational Chart
- Part 8: Example
Part 1: What is an Organizational Chart?
An organizational chart is a visual representation that depicts the company's internal structure through the description of roles, responsibilities, and relationships between entities and individuals.
What are an organizational chart's alternative terms? Organizational charts are also known as org charts, organigram or hierarchy charts.
Part 2: History of Organizational Chart
What is the organizational chart's history? The first organizational charts date back to around 1854 when Scottish American engineer Daniel McCallum developed org charts for Erie Railroad company. It was the largest but extremely disorganized railways business. They were expanding at a great rate, but the disorganization was severely affecting its performance. McCallum came up with the diagram to introduce a sense of order and control within the organization. McCallum's focus remained on the division of responsibilities and making roles and responsibilities well-communicated and transparent.
Later in 1917, another symmetrical pyramid form of org chart was developed for the thriving company Computing-Tabulating-Recording Company (CTR). This chart showed functional divisions along with geographical and departmental subdivisions. CTR was later renamed International Business Machines (IBM). This functional structure became the standard for the industry for as long as till the 1950s.
In the 1960s, we saw the evolution of org charts into a structure based on products and then functional divisions under the products. Companies at those times believed that they needed to have various divisions or product groups as separate entities. Within these entities, they had different functional areas for more efficiency, each with its functional areas.
The 1970s were the times of matrix organizational structures, which were later changed into flat structures for more autonomy and independence.
Part 3: Advantages and Disadvantage of Organizational Chart
What are an organizational chart's uses? Well, they are too many. They can show the chain of command, responsibilities, roles, and the adopted managerial style. This is why organizational charts have become an essential document used in all companies, small or large.
They are used as a reference while switching job roles, adding or removing employees and also during a presentation to give an overview of the organizations. For the new employees, org charts must have to help them better understand the overall structure and reporting hierarchy within the company.
Advantages
1. Org charts show a clear reporting structure. It helps employees to know exactly how and what to communicate and where to report. In case of emergencies, a company can save a lot of precious time with a straightforward reporting structure. With a detailed org chart, everybody knows who is the relevant person to inform.
2. They are a lifeline for new employees. Org charts introduce them to people they will work with and connect with them easily.
3. Org charts are also helpful in balancing the workload of managers. As we can see from the org chart, how many people they are managing can balance accordingly. Also, the coherence of the job delegation is improved when we know what department does an employee belong to and we only give them respective tasks.
4. They are very helpful in planning. Resource allocation, workforce management and human resource management cannot survive without an org chart.
Disadvantages
1. Maintenance of organizational charts is very cumbersome, especially if done manually. In large organizations where the staff is regularly changed, manual maintenance is time-consuming and effort-intensive.
2. Informal communication channels are often ignored. Information about horizontal relationships and social interactions are scarce. Organizational charts are only focused on formal relationships based on managerial style.
Part 4: Use Case of Organizational Chart
What are organizational chart's use cases? Organizational charts are used in many fields for a diverse range of purposes. Let us discuss a few use cases.
1. Budget and resource planning
Org charts give valuable insight into human resource planning because an org chart shows if any resource has too many responsibilities to handle and a need to introduce more workforce. Similarly, the downsizing org chart shows where excessive employees are allocated.
Budget allocation towards human resources is also managed the same way.
2. Internal communication
Org charts promote internal communication within and between different departments in many ways. With an org chart, everybody knows who is the most relevant person for any situation in a department; therefore, all the queries and general communication are exchanged with this particular resource rather than shuttling between different people.
Secondly, within the departments, a clear chain of command and reporting hierarchy tells the employees to take orders and give feedback. It slashes down a lot of wasted time.
Part 5: Types of Organizational Chart
What are organizational chart's different types?
a. Hierarchical organizational chart
Hierarchical chart groups the employees by department and skill set. It has a clear chain of command and reporting channels to show the managerial style and supports communication. This classic model works the best for medium to large organizations.
b. Matrix organizational chart
The matrix organizational model has its foundation in cross-functional groups. This chart is suitable for organizations with multiple product lines because it encourages open communication and collaboration between departments.
c. Flat organizational chart
Since flat organizational charts remove some layers that might not be relevant for smaller organizations like startups, it is a preferred model for startups and new organizations. This chart facilitates quick decision-making. However, as the company grows, you might want to shift to some other organizational model because a flat organizational structure cannot adjust to substantial changes.

An all-in-one platform for 210+ diagrams.
・ Simple alternative to Visio
・ 26k+ symbols
・ 10K+ free templates
・ 10+ AI diagram generators


Part 6: Common Symbols/Element
Entities
Different types of entities in organizational charts are;
1. Roles. These are used in generalized charts like Managing Director, Sales Manager etc.
2. Detailed Information. Detailed information entities start with atomic details like name, role, and contact details. Later, further details can be hyperlinked to make the chart compact.
3. Photo. In these types of entities, a photo of the resource is also added along with other details.
Connections
These lines can show communication, reporting connection as well as a hierarchy.
1. The solid line shows a primary relationship.
2. Dotted Line. This dotted or dashed line depicts secondary relationships.
Part 7: Tips for Organizational Chart
1. Divide and rule. Organizational charts for medium to large companies can easily span both vertically and horizontally. Therefore a better approach is to divide the organizational chart into various sub-charts and connect them with the main org chart by hyperlinks.
2. Start with a general org chart with the names of roles and gradually add more details like the names and details of the employees holding those positions.
3. Work neatly and add colours and shapes to make reading the chart easy.
Part 8: Example
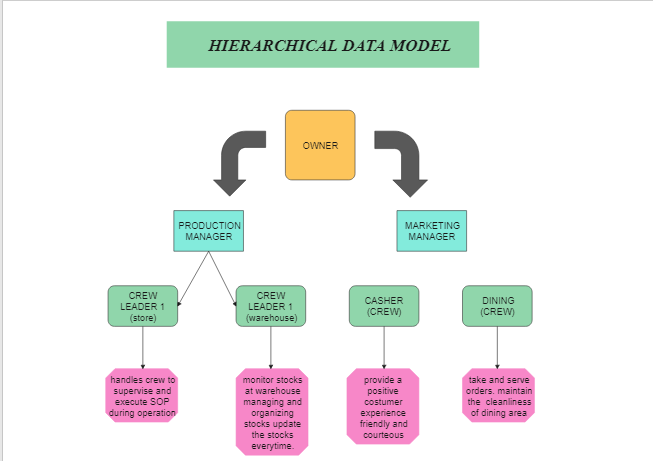
This is an organizational chart of a company. It has two roles under the primary owner, production manager and marketing manager. The production team includes store and warehouse branches, which handle crew to supervise and execute SOP during operation.
Organizational charts are an essential tool for the success of any company. However, the true value of an org chart can only be achieved through accuracy, detailing and continuous maintenance.


