Fault Tree Analysis Software
Design a custom FTA analysis for free with easy-to-customize templates and symbols.
Trusted By Over 30 Million Users & Leading Brands


Why EdrawMax to Make Your Fault Tree Analysis?
Identify the potential cause of failure
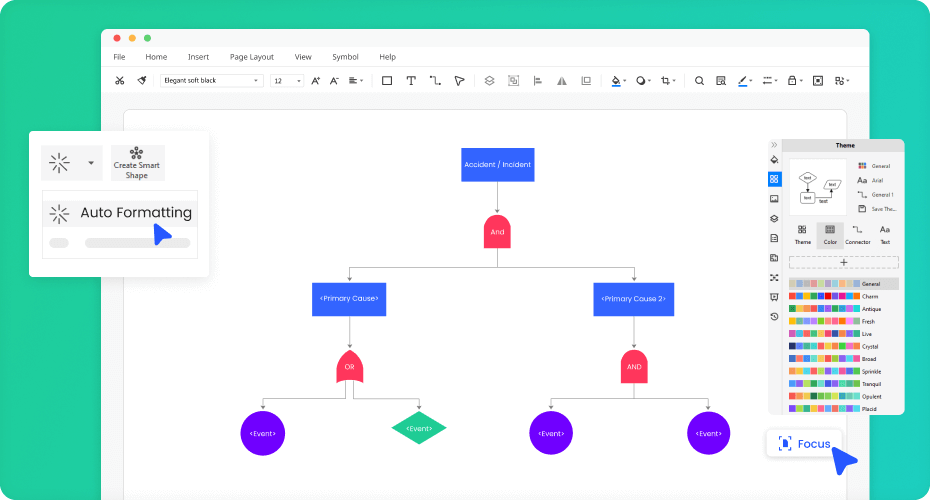
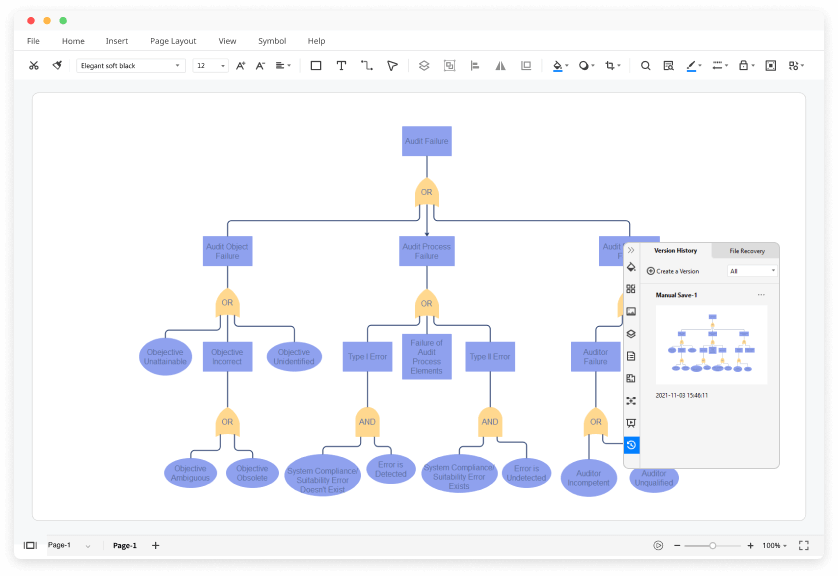
Performing fault tree analysis is a breeze
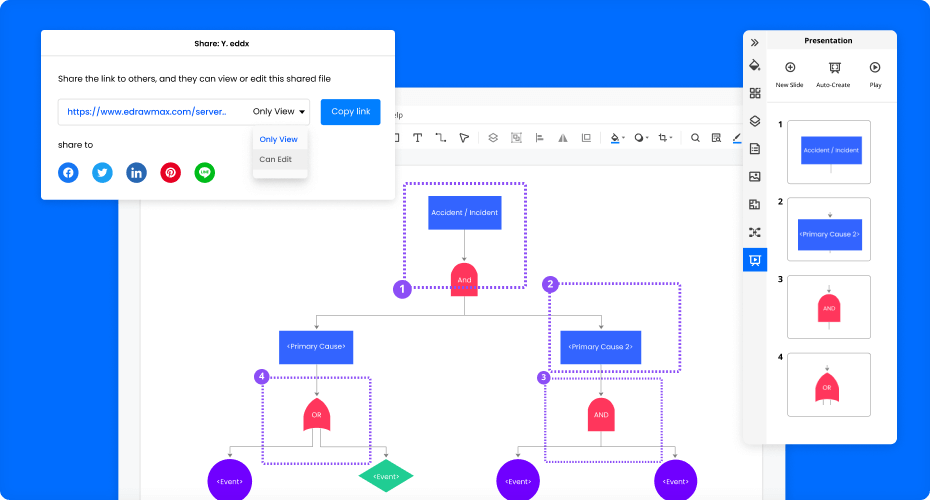
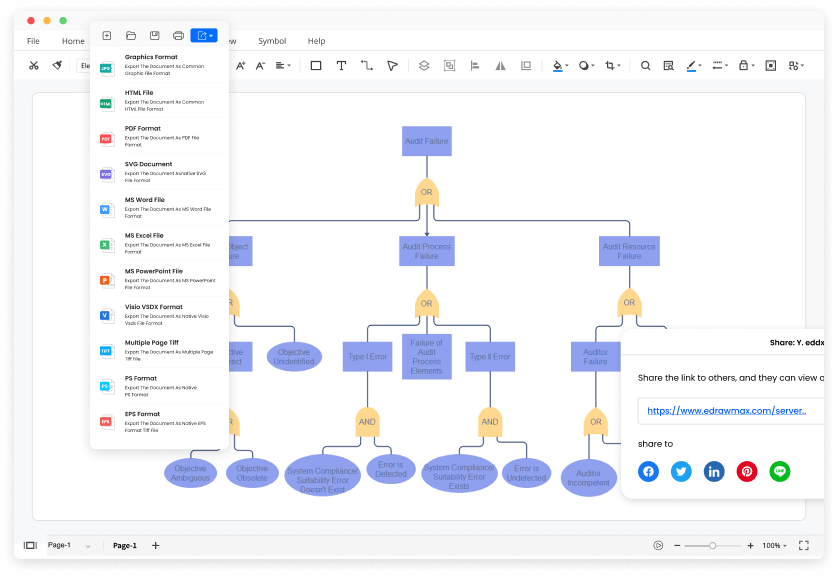
EdrawMax lets you share the work
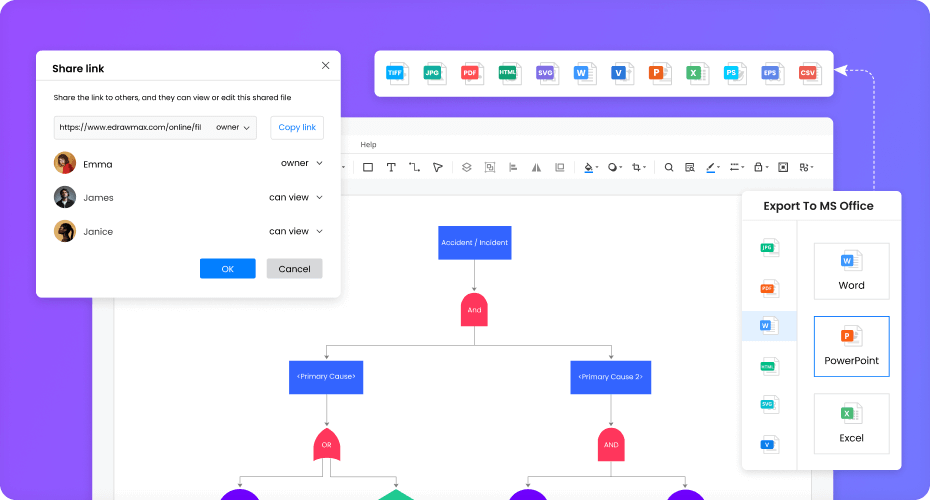
Present and collaborate confidently
More Features Of Fault Tree Analysis Software
Visio files import and export
Customized fonts and shapes
Insert images and attachments
Infinitive canvas
Various color theme
File encryption and file backup
How to Make a Fault Tree Analysis?
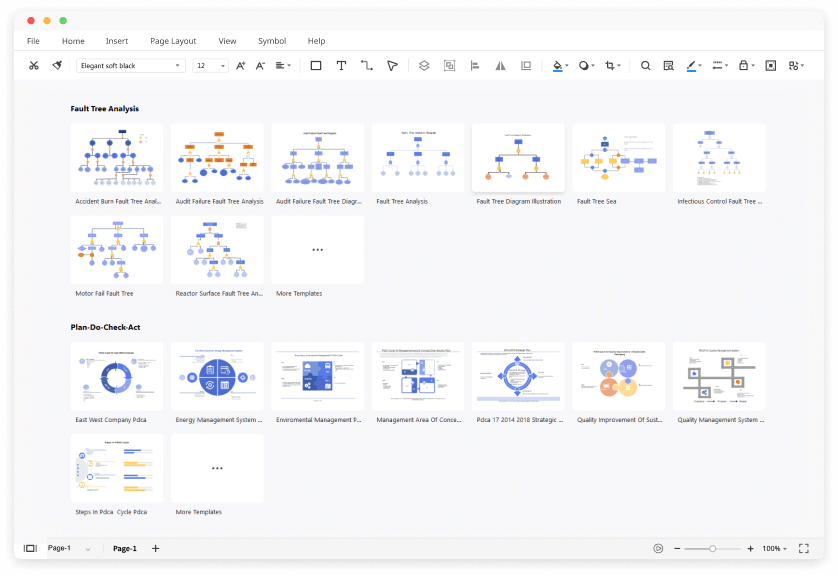
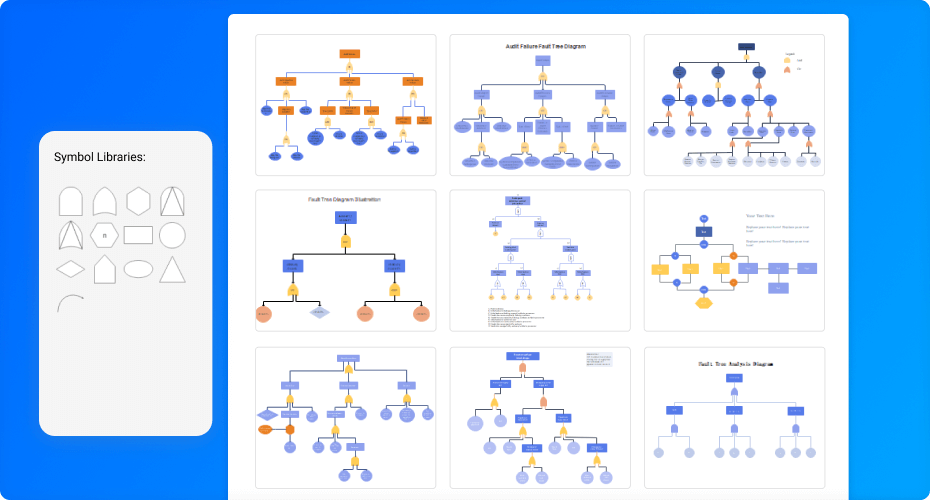
Edraw Fault Tree Analysis Templates
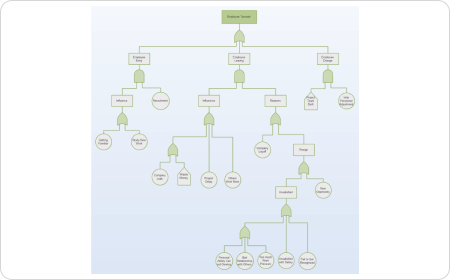
Fault Tree Analysis Example
The fault tree analysis is used in safety engineering and reliability engineering to minimize the chances of risk by determining the event rates.
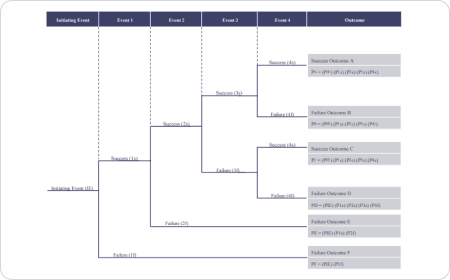
Event Tree Analysis
Event tree analysis examines the sequence of events linked by probabilities and can handle better probability sequential notation.
Fault Tree Analysis PowerPoint
Fault tree analysis is created on PowerPoint by using SmartArt graphic and by using basic shapes and templates.
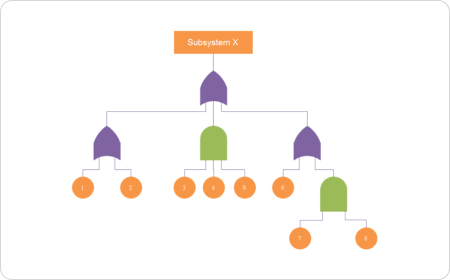
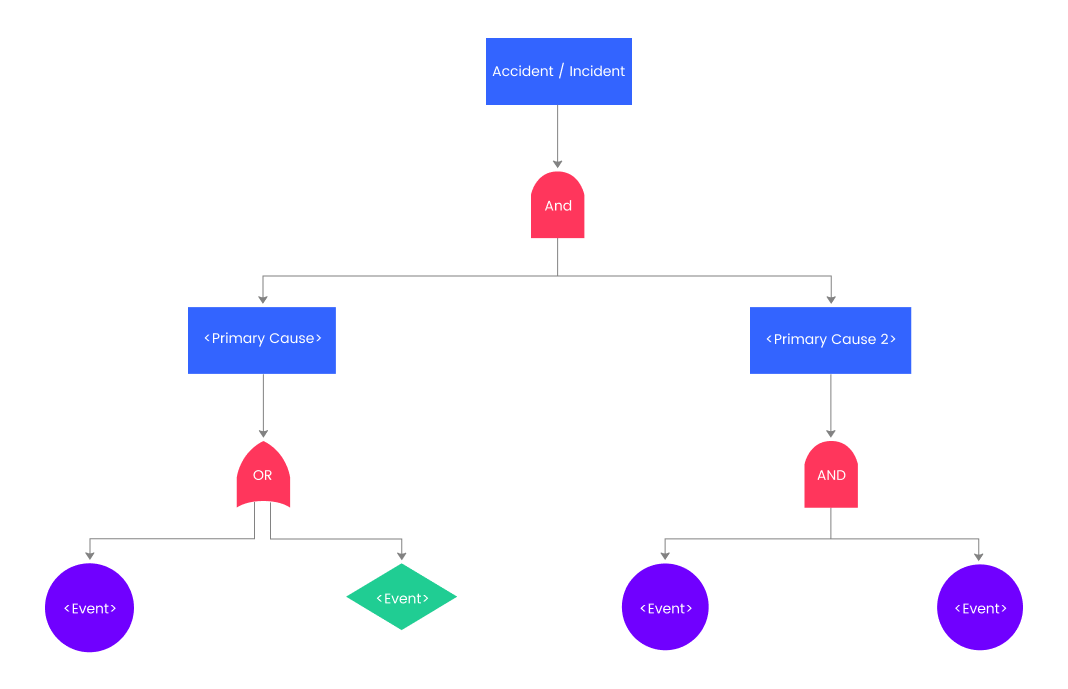
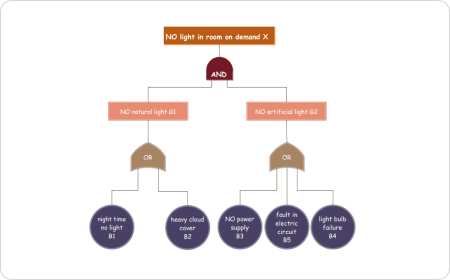
Fault Tree Diagram
A fault tree diagram is a logic block diagram that displays the top event and its components (basic events).
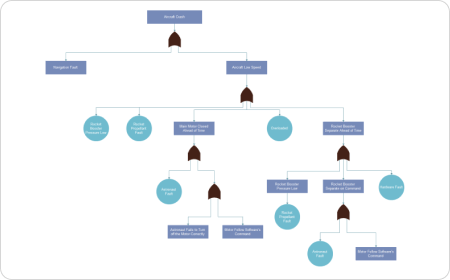
Failure Tree Analysis
It is a top downed failure analysis tool to identify the system level fault or top event even before its occurrence.
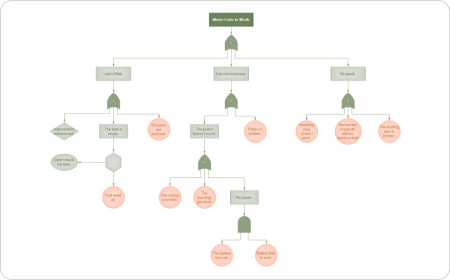
Engineering Fault Tree Analysis
Engineers use a graphical tool to identify the fault by top down approach and identify the component level failure to detect system level failure.
Fault Tree Analysis FAQs

Does EdrawMax have any free fault tree analysis templates?
Except for the pre-made fault tree analysis templates in EdrawMax, you can download and customize templates from our Template Community. All the community-made templates are free to use for Edrawers.
How can I share my fault tree analysis with others who don't use EdrawMax?
When your fault tree analysis is complete, you can post it on social media, publish on Edraw Template Community, or export the file as Word, Excel, PowerPoint, Visio, PDF, SVG, PNG and JPG. EdrawMax is dedicated to delivering a superior user experience.
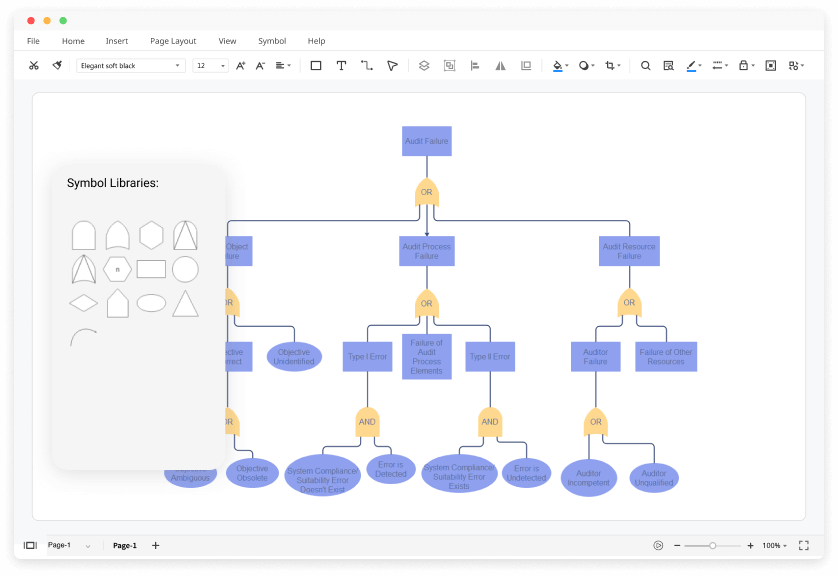
How can I find fault tree analysis symbols that I need?
No worries. You can find fault tree analysis symbols by opening and searching in the preset symbol libraries of EdrawMax.
How can I create a fault tree analysis from scratch?
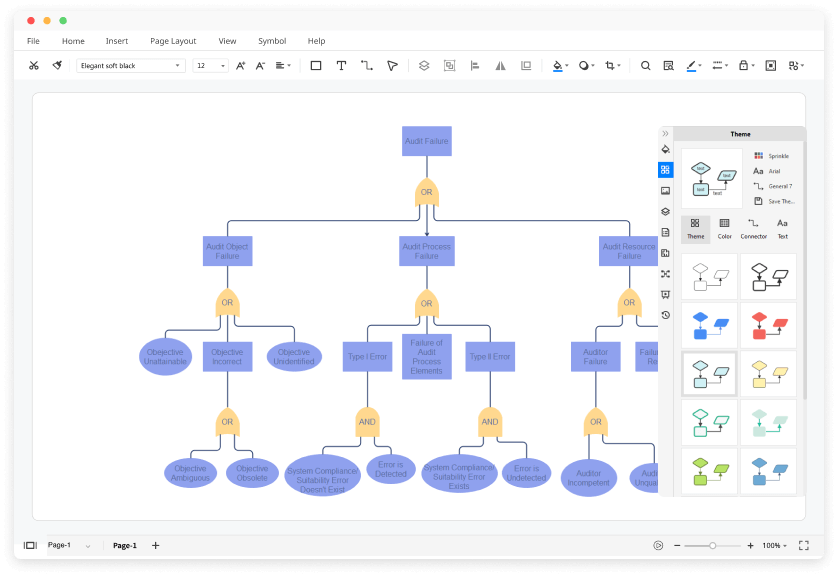
You can create a fault tree analysis from scratch by dragging and dropping symbols from the libraries and customizing colors, fonts, lines, etc. All the symbols in EdrawMax are vector, editable, and catered to different types of fault tree diagrams.
Is EdrawMax's fault tree analysis maker free?
YES! It is free to create different fault tree diagrams in EdrawMax. There are free templates, symbols, and easy-to-use editing tools for making fault tree diagrams. Just download it and try EdrawMax now. You will love it right now.
More Resources
Unlock your diagram possibilities by exploring more diagram makers here.
Find more ideas, tips and knowledge to help create fault tree analysiss.
Need help? Find the instruction or contact support here.
