Value Stream Map Symbols and Their Usage
Value Stream Map Symbols
The following is an Edraw library template which includes the standard value stream map symbols to illustrate the flow of material and information in a lean manufacturing process. View a detailed Value Stream Symbol Legend.
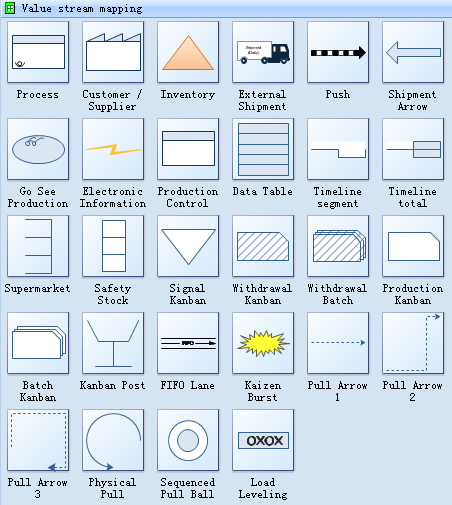
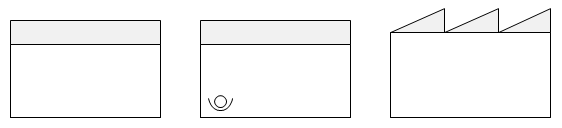
Process represents a step in your process and shows flow of process steps required to complete a product, service or administrative function from order to delivery.
Customer / Suppliers have already adjusted to the requirement for more frequent delivery. Often, to get small batch delivery, all one has to do is ask. But to make this change successful, suppliers need something in return: They need good information, steady schedules, and a non-adversarial relationship.
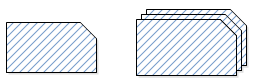
Inputs and outputs identify changeover and cycle time, labor, and rework.
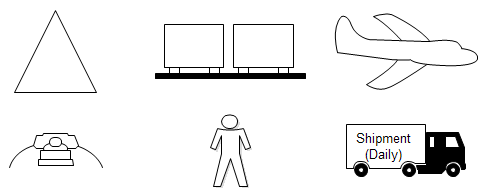
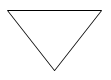
Inventory uses an equilateral triangle in the value stream mapping.
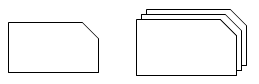
State Map is simply a set of connected operations and queues, starting with a supplier and ending with a customer.
Timeline is used to represent and compare the two, but didn't focus on the resources consumed and waste generated in making the product.
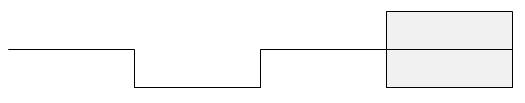
Materials line, located on the bottom of a value stream map, shows the amount of raw materials used by each process in the value stream and the amount of materials that end up in the product and add value from a customer's perspective.
Signal kanban is sent upstream, to an operation which is shared by a number of product families.
Withdrawal kanban is used to authorize movement of material from a supermarket or storage location, usually in small quantities.
Production kanban is like signal kanban, except that they are sent only to dedicated upstream resources.
Batch arrival is used if withdrawal happens in a large quantity, such as when a truck is loaded and sent to a customer.
Sequenced pull ball is a method of sending a requirement to a subassembly station for a particular subassembly to be built
Supermarket is another form of kanban square, where one or more items are held in each opening, and a signal kanban is sent when the minimum quantity is reached.
Fifi lane is a kind of kanban square. This means
that an empty storage spot is self-authorization to produce a product for that
square.
Funnel shaped value streams are those with large incoming amounts of
material, and fast initial processing.
Pyramid shaped value streams are the opposite of funnels. They have slow,
steady incoming materials and orders, and intermittent, large outputs.
Pipe shaped value streams are already well on their way to becoming lean, because they have the basic shape required for flow
A value stream map is more complex than process flowchart. A good design software and standard value stream map symbols will save lots of time and improve productive.
Edraw helps draw a value stream map more easily. Double click the open the Value Stream Map template. From the Value Stream Map Symbols, drag shapes onto the page to represent your processes, kanban, and materials. Then draw connector that indicate the flow of information or materials on the page. You needn't the drawing skill.
Discover why Edraw is a good choice to draw Value Stream Mapping: Try it FREE.
With a large quantity of pre-drawn examples and more than 12000 symbols, drawing couldn't be easier!
More Materials


