Process Flow Diagram Examples
High-quality PFD examples with lifelike symbols are provided to download and edit. Each example is using vector shapes of high clarity.
As we all know, process flow diagram requires professional symbols and are not easy to draw from sketch. Therefore, EdrawMax prepared all useful PFD symbols ahead, in order to decrease the drawing time for users.
All equipment symbols you see in the following examples are included in the Edraw PFD software. When you download any of the examples and open them, you will find the symbols on the left of the canvas. With some easy dragging and dropping, you can finish your own PFD diagrams, with no professional skills required. If you are trying to document a process flow diagram, this must be your perfect start. You can save lots of money from hiring someone to do it.
Contents
What is a Process Flow Diagram
The Process Flow Diagram is a graphical representation and visualization used to illustrate major components of an Industrial plant or manufacturer. It is widely used in Chemical/petroleum or process engineering. Its applications are also used in business projects. It helps to understand the process, model a process, ensure quality control and standards plus increase efficiency of the process. It maps out the whole process from scratch to show how equipment and chemicals work in the plant.
It is a visual way of stating a process, it includes tasks, steps with their sequence. Flowchart is very important in project management and orientation or it is a fundamental tool because it enhances workflow efficiency and effectiveness which makes the project transparent. The flowchart not only assists team or project stakeholders to visualize all phases of processes and workflows in a project, but also brings all members on a single page.
When to Use a Process Flow Diagram?
- To document an Industrial or business project process and phases for better acknowledgement, quality control and training of subordinates.
- To exemplify the sequence of activities required for its accomplishment.
- To model an existing process for better understanding or develop a new process.
- To regulate a process for maximum efficiency.
- It is used to have a deep study of a process to accomplish a target or an end. It helps to show every step of the process, timeframe, deadlines and other inefficiencies.
- To communicate and engage with flowcharts that speak various roles of the stakeholders in the organization or outside of it.
Business Process Flow Diagrams
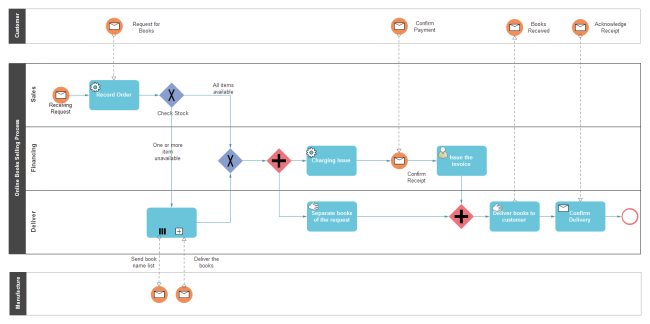
A business process flowchart is the simplest and the initial step of a Visual representation of a process. It helps to have a broad and clear picture of what the process is.
It is used to document each step that a business takes to complete a process, from recruiting to hiring, assigning tasks a responsibility and the skills that it entails, ordering a raw material and shipping a product. It lays out the steps that a business will take to ensure that it has the right number of employees with right skills in the right place with right resources and material at the right time.
Once the flow diagram is completed it is now ready to assist the project managers and team to analyze, change, and implement specific project plans and objectives to accomplish the target. A flowchart is a visual assistant of the team, designed to visualize and organize the sequence of steps to follow during the project management and orientation process.
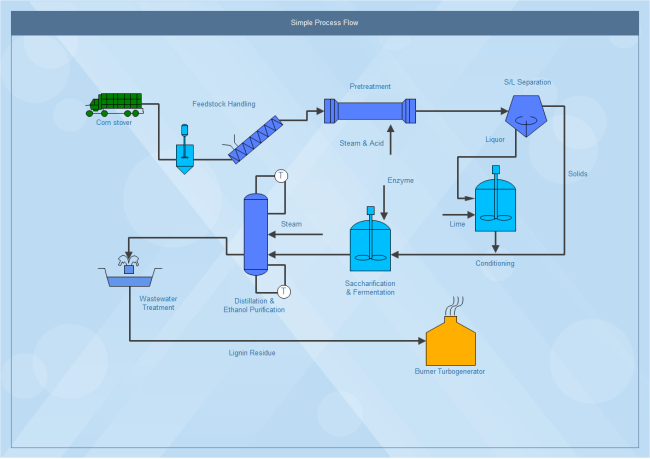
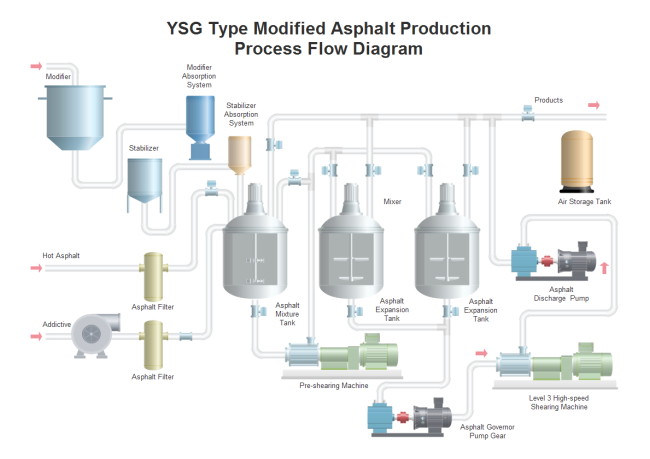
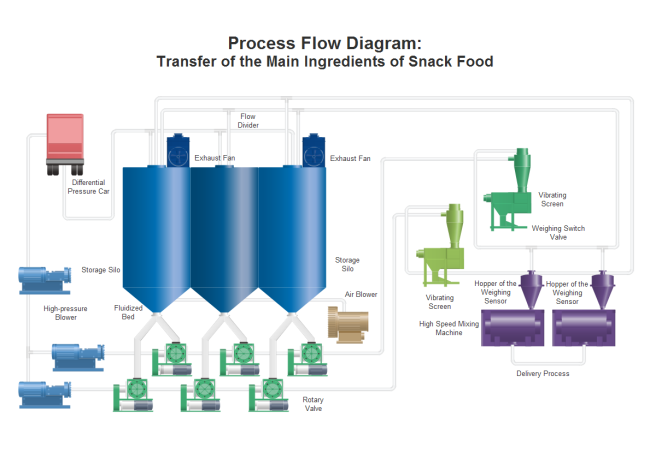
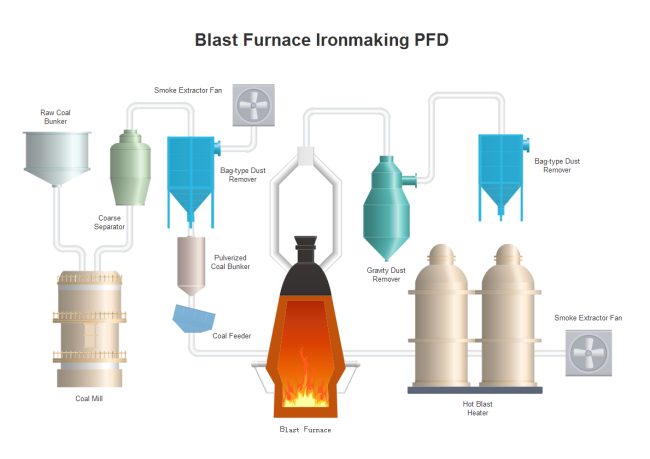
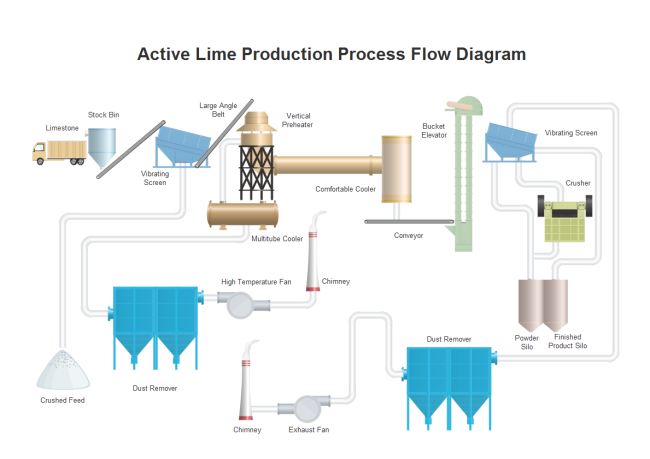
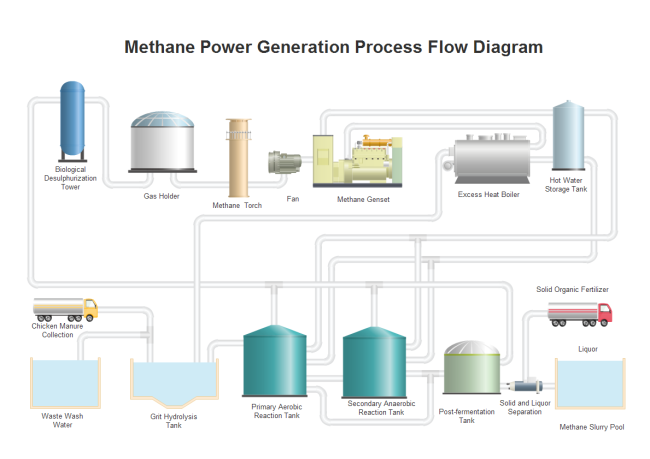
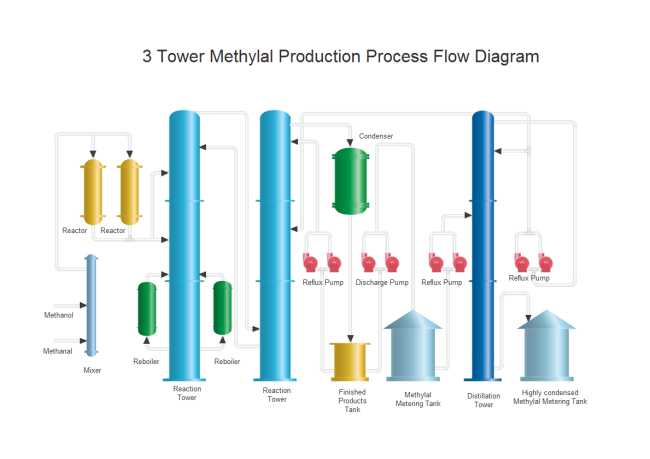
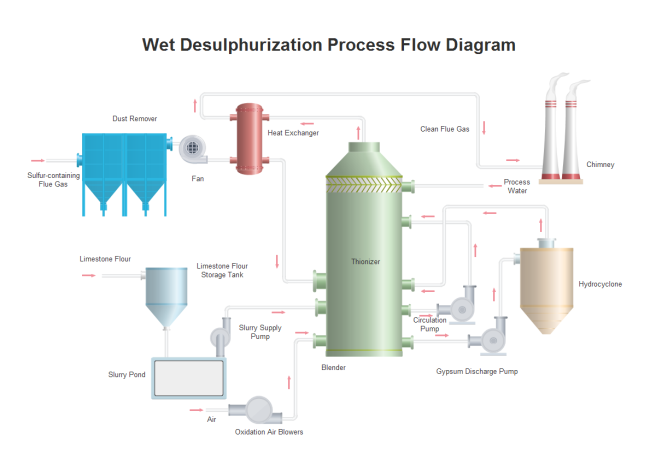
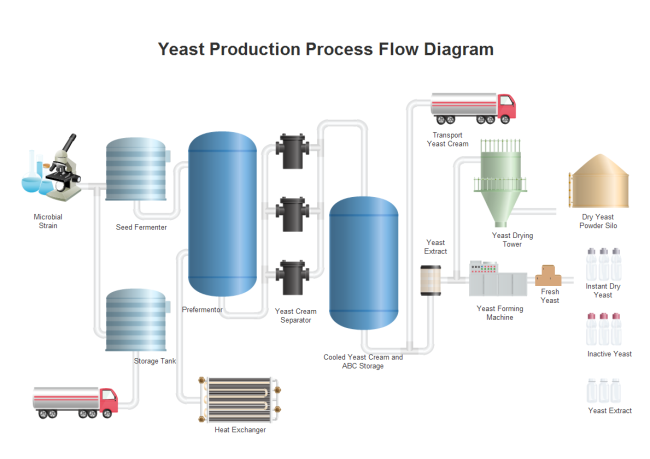
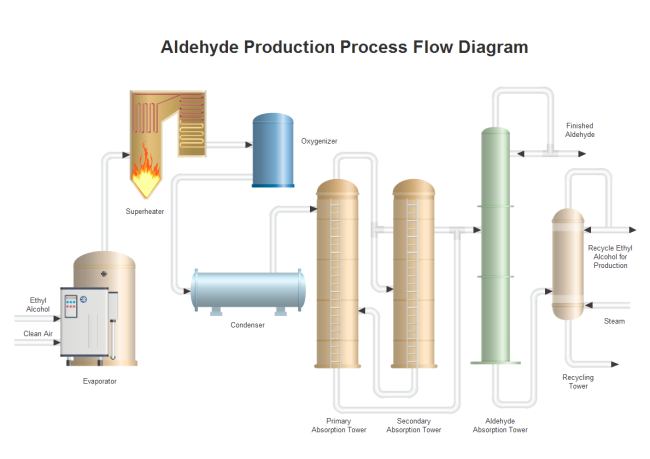
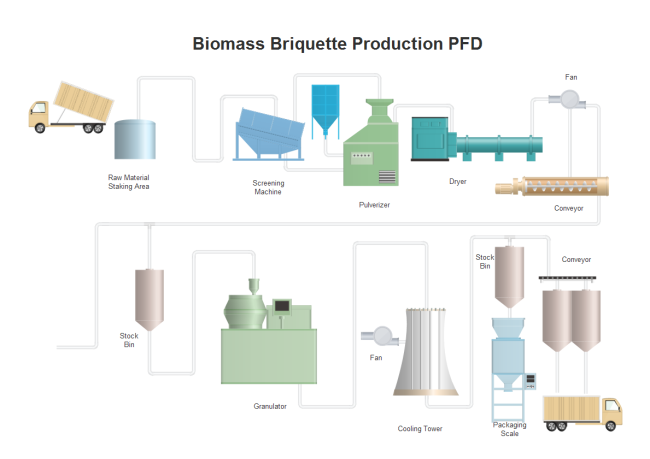
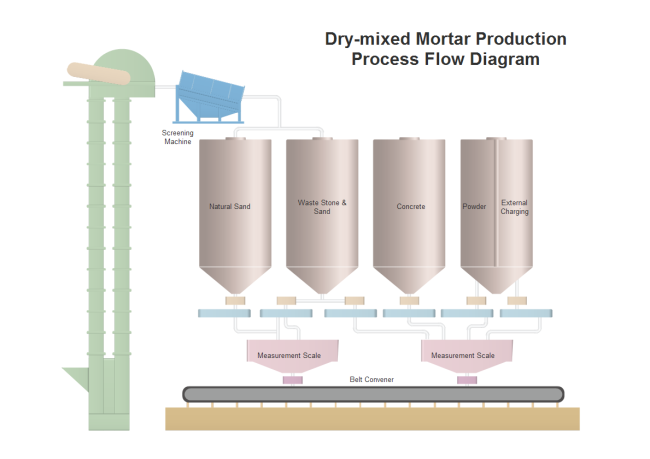
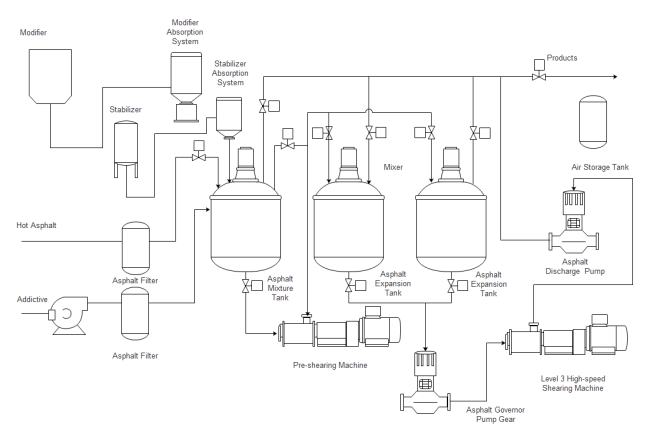
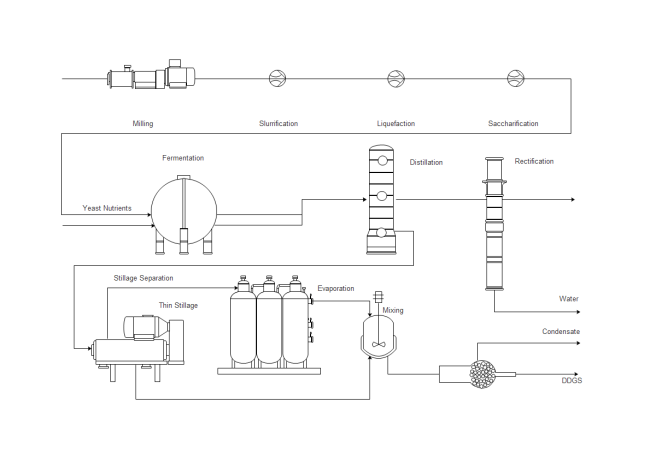
Production Process Flow Diagrams
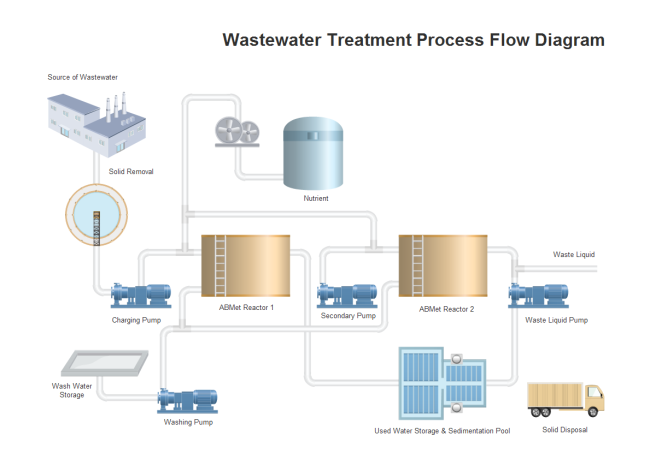
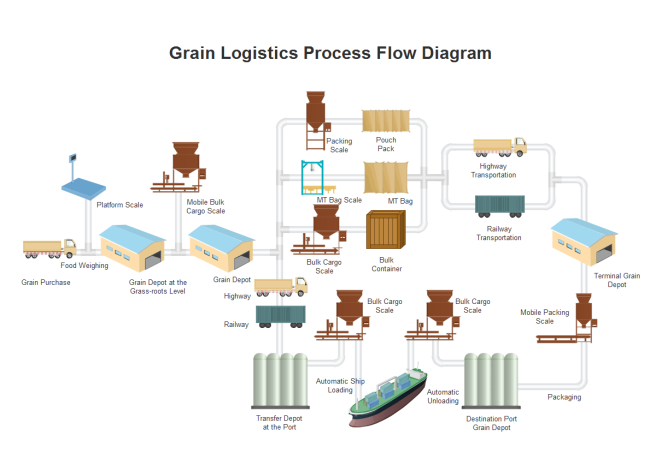
Production process flow diagrams or process workflows, states every activity level steps that must be accomplished to create finished goods from the resources (time, money, people, raw materials etc.)
Big and renowned manufacturing industries are constantly working to improve their quality standards as per their core values and process flow diagram is one of many tools that can help Industries to optimize their manufacturing processes and optimal efficiency.
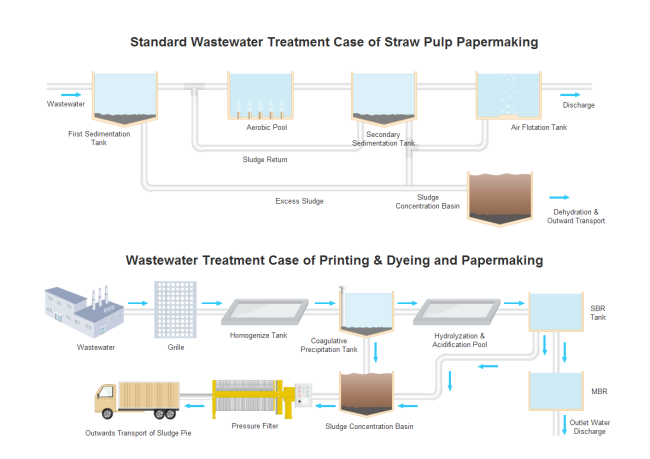
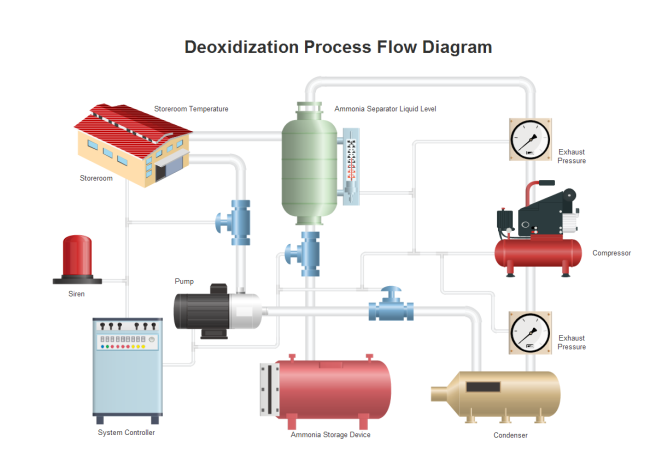
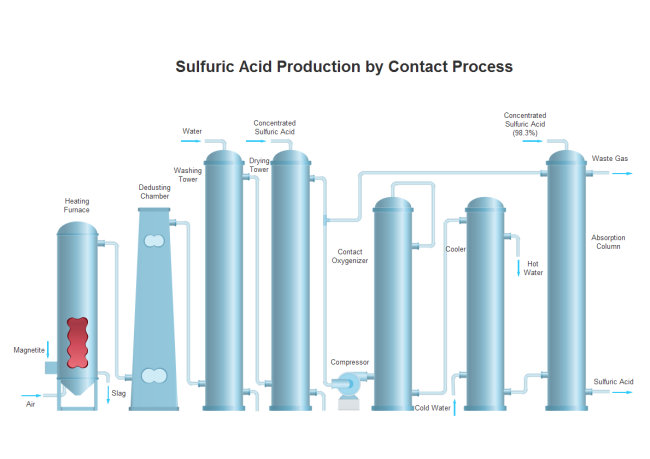
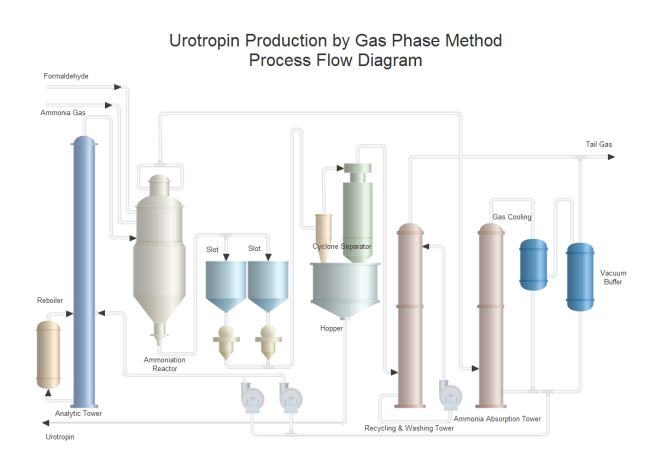
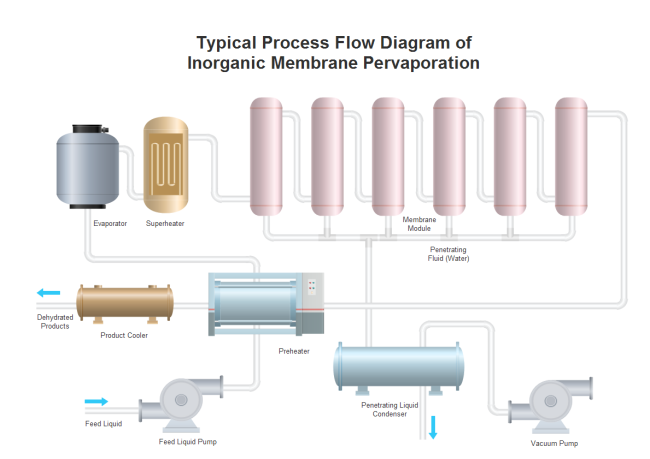
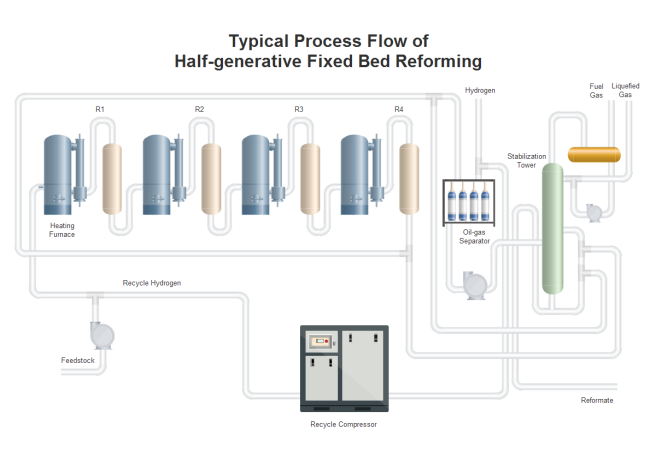
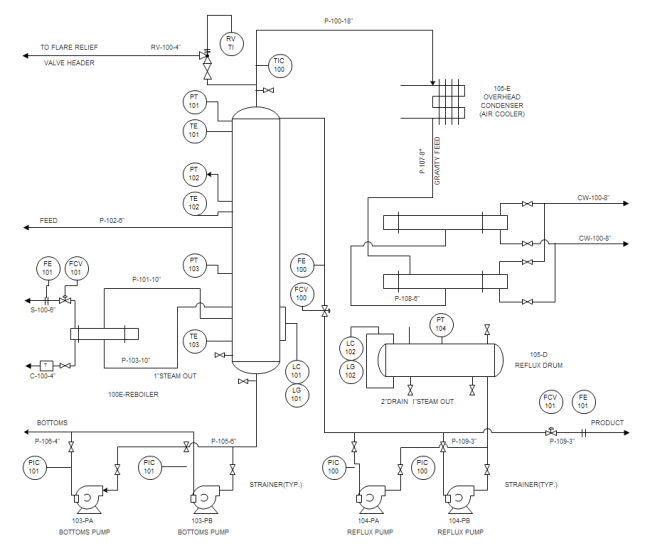
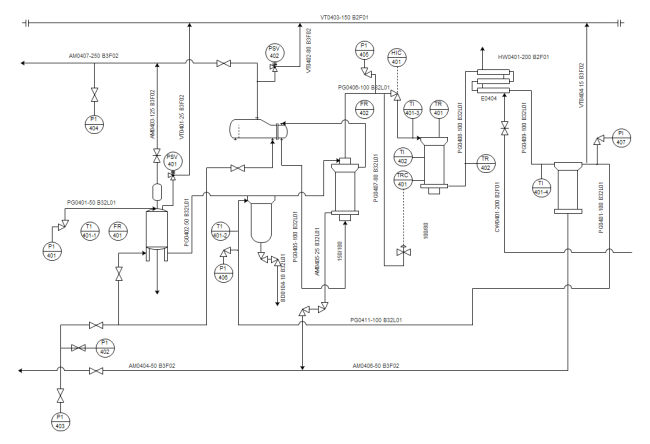
The process flow diagrams are often used in chemical engineering and process engineering, to develop a process from scratch to end. They use a series of symbols and notations, arrows, labels and textboxes to document a process.
Process flow diagrams are a significant and a must tool for the improvement of processes. By providing a graphical and visual representation, it assists project teams to identify the different elements and phases of a process and understand the interdependence among the various steps.
Flow diagrams may also be used to gather information and data about a process as an aid to decision making, quality controls or performance evaluation and monitoring.
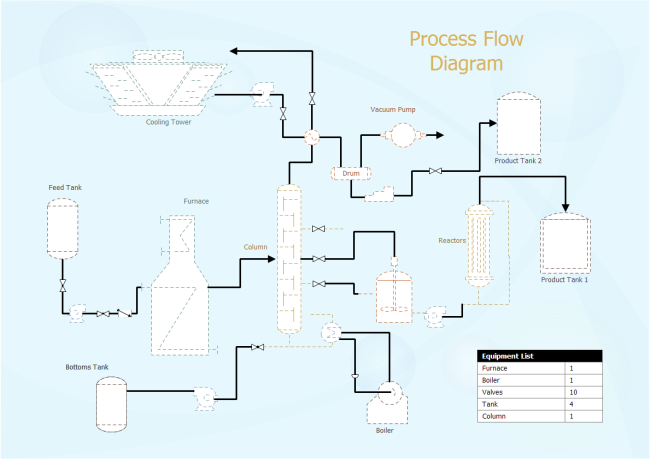
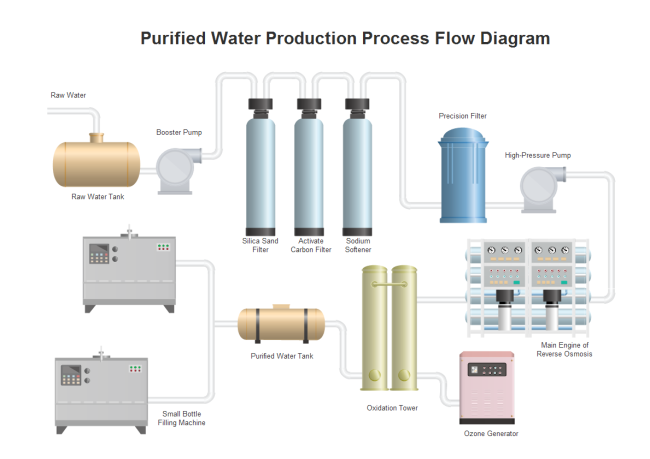
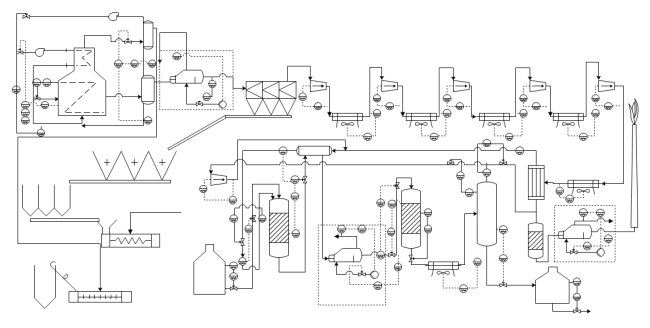
Schematic Process Flow Diagrams
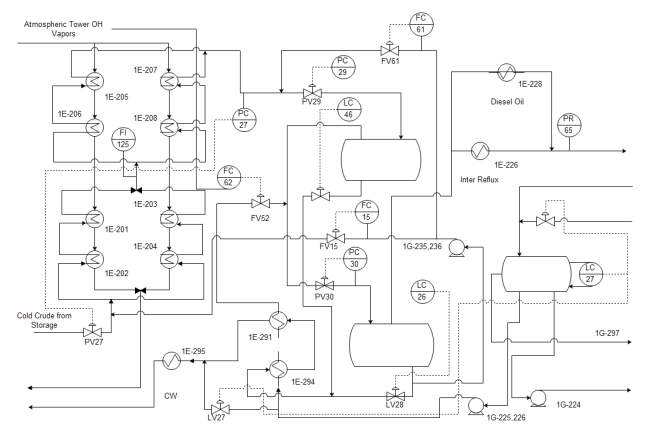
Schematic flow diagrams are also called Block Flow Diagrams. It consists of blocks, depicting a single piece of equipment or a phase in a process. The rectangular boxes are joined together with arrows and are usually used to show a piece of equipment in a process and labels state the function.
Schematic diagrams are used to illustrate a high level performance of a system or a process. They simplify and assist communication by visualizing the relationships between system components and making them more obvious and clear to understand or recognize.
A schematic diagram is a graphical representation that illustrates the major components of a process, plant, or other object using theoretical labels, often standardized symbols, connectors and arrows. These diagrams only portray the important or major components of a plant, and usually ignores minor components, some detailed information in the diagram may also be overemphasized or introduced to assist the team members in understanding of the system.

An all-in-one platform for 210+ diagrams.
・ Simple alternative to Visio
・ 26k+ symbols
・ 10K+ free templates
・ 10+ AI diagram generators


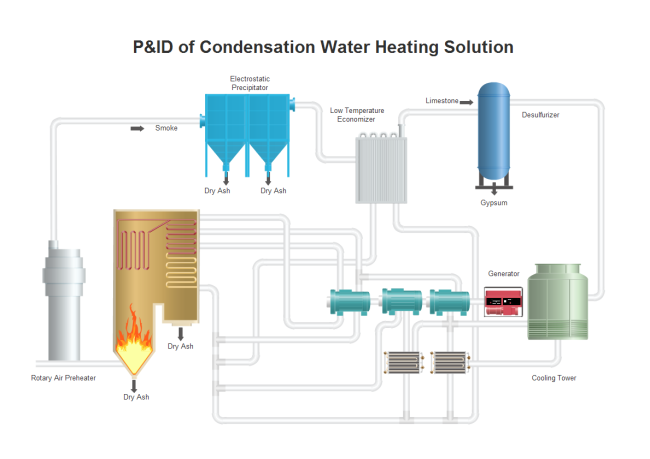
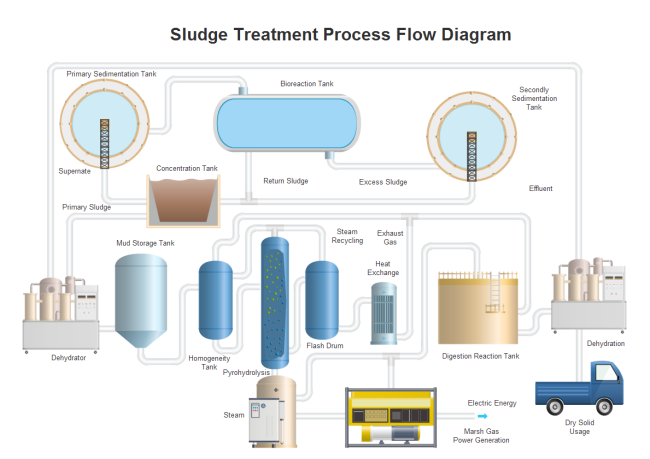
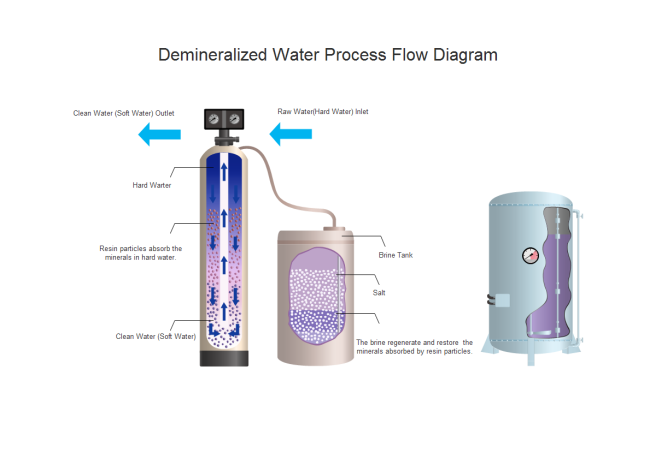
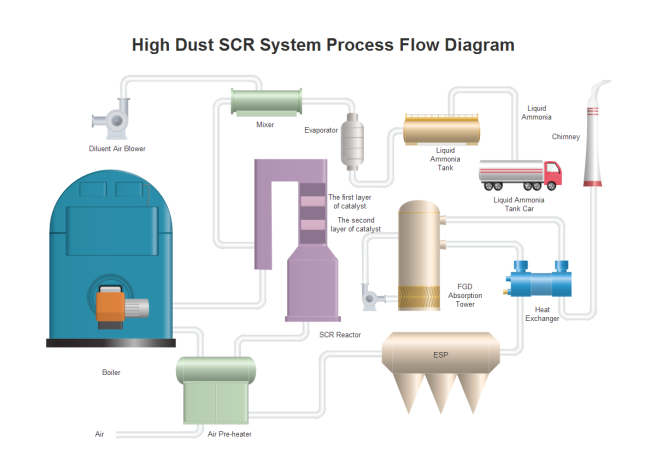
More Free PFD Diagram Examples

Use EdrawMax for Process Flow Diagram Creation
A process flow diagram provides a way of documenting the steps in a process. It helps to have a better understanding of what the process steps and phases are. It is also an easier way to see where a process can be measured or improved when looking at a process flow diagram. A process flow diagram helps in identifying what is useful and eliminates waste and unnecessary information.
EdrawMax is Pro industrial, chemical, production or business process documentation software for making process flow diagrams, workflow diagrams, general flowcharts and technical charts by providing thousands of worthy templates.
The flowchart or the diagram created in EdrawMax consists of graphical keys and notations including symbols, interface points, labels, callouts and textboxes to describe every phase and step of the process.
Everything a team manager does requires to design process flow diagrams online. Get started with EdrawMax worthy templates library to create impressive, eye catching, easy to follow and understand process flow diagrams in no time. With a menu driven and graphical user interface and drag and place capability, it's easy for a user to make a process diagram in EdrawMax.

More Related


