Flowchart Software - Create Flowchart Quickly and Easily
Flowchart Software
Edraw Flowchart is a powerful but easy-to-use flowchart software which makes it easy to create professional-looking flowcharts based on pre-drawn flowchart symbols and examples - with no drawing required.
Free flowchart templates, symbols and examples will help to quickly create new flowcharts, workflow, NS Diagram, BPMN Diagram, Cross-functional flowcharts, data flow diagrams and highlight flowcharts. Numerous colors, fonts, shapes, styles, and symbols for each object in your flowchart are available for you to create your own templates that can be saved for future use.
Discover why Edraw is an awesome flowchart creator: Try it FREE.
System Requirements
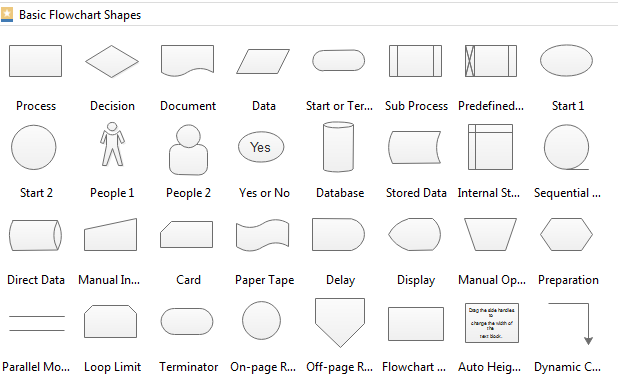
Use Standard Flowchart Symbols
Flowchart uses special symbols to represent different types of actions in a process. Edraw offers the full set of flowchart symbols in the predefined library. Just drag and drop the symbol you need, and use the smart connectors to connect the symbols. The symbols can be easily customized.
Create Flowchart Quickly and Easily
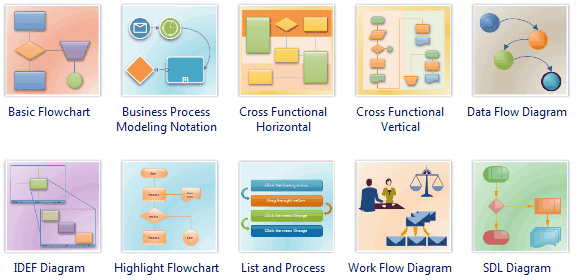
Start with Templates
Edraw flowchart software has some great new tools for creating visually appealing flowchart, workflow and business process quickly and easily. To efficiently create the flowchart, it is best to start from the flowchart examples and templates.
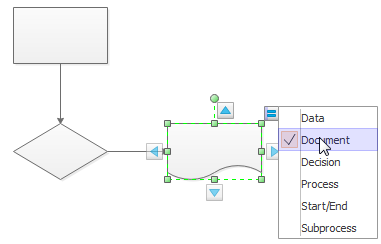
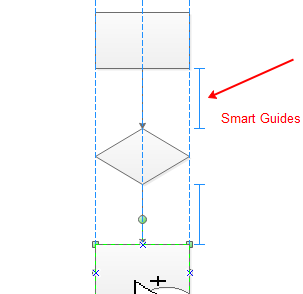
Draw Automatically
"Automatic" features refer to automatic connecting of shapes, automatic alignment and automatic spacing. Add one shape to start, and click the floating buttons only to finish the rest. This advanced function greatly improves work efficiency.
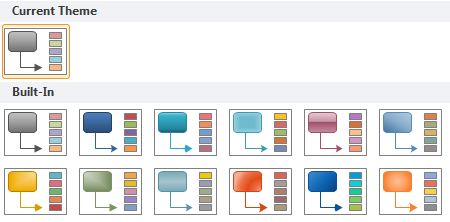
Make it Attractive
Make your flowchart visually pleasing by applying quick styles and themes. Once you have the basic flowcharts completed, it's time to change the theme effect of all drawings. When you apply a theme, it changes on colors, shadows, connector styles, and gradient effect. These are the various themes you can apply to the flowchart.
You do not need to be graphic design expert to insert professional-looking content.
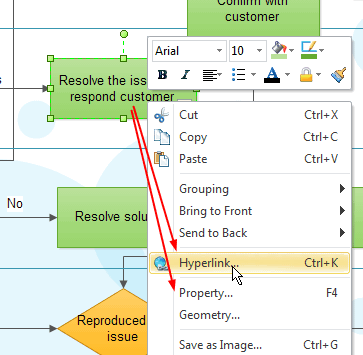
Another feature is inserting hyperlink and defining data. This allows you to navigate the flowchart more easily.
A good way to help the flowchart stand out better is to change the background of the document and insert clipart. There are some simple flowchart examples with the operation steps and different options shown above.
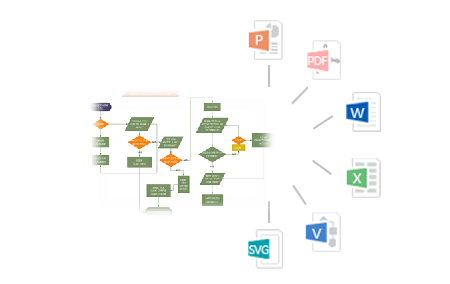
Share Vector Flowchart in Word, Excel and PowerPoint
As we know, it's not easy to build flowchart directly in Word, Excel, or PPT. However, sometimes we do need to display flowchart in these commonly used formats. With Edraw, 1 click will solve this problem. It's fully integrated with Microsoft Office and can transfer flowchart to Word, Excel and PPT format with no quality loss. The exported flowchart remains vector format in Microsoft Office documents.
Top 10 Flowchart Software Features
- Vector-based flowchart software facilitates the rapid creation of flowcharts, workflows, process flowcharts and more.
- Easy to Learn, Easy to Use. Drawing does not need to start anew. Just drag the ready-made shapes from the library pane and drop them on your page. Done. Drawing couldn't be easier.<
- Rich pre-drawn templates, including basic flowcharts, organizational charts, business charts, hr diagrams, work flowcharts, programming flowcharts, process flowcharts and network design diagrams.
- Typical examples. It offers the example storehouse to collect, manage various kinds of works of excellence.<
- Powerful functions. No artistic skill is required. WYSIWYG - What you see is what you get. Create your professional diagrams with minimal effort and time. Automatically align and locate everything to look great.
- Beautiful style. It provides abundant arrows, line styles, gradient fills and textures for each object. Predefined color schemes and styles give you more creativity.
- Works easily with other programs. It can export to Word, Excel, equation files with a single button-click. Insert your Edraw charts into other documents in just seconds.
- XML file format. Save in many common graphic formats and print exactly what you see. Enhanced export features include BMP, JPEG, EMF, WMF, PDF, SVG, HTML, Multiply TIFF and SlideShow, to name a few.
- Smart connecting. Connecting shapes with smart connection lines that maintain flow and relationships easily.
- Live update - you will be notified when a new version or new templates are available for download. You can download the new version directly from within the program.
Review Edraw Flowchart Software
"Thank you! Your flowchart software is outstanding! 1. Edraw uses the familiar Microsoft Office user interface, and it looks great! 2. Fast and small! 3. Has the right features! 4. Affordable price. I hope you keep the promotion price. Home users and students can't afford software like Visio."
"I can't recommend this flowchart software enough. Edraw has unbelievable functionality for the price. Makes stunning flowcharts like nobody's business. It's such useful software in such a small package, and goes to show how bloated today's software truly is. Best of all, it can export the flowchart to many kinds of formats. I made my flowchart and exported it as a jpg file, so I could put it on my website. Real easy!"
"Great value for money! If flow diagrams are the only thing you plan to use it for, Visio is a little overkill. If you want to use it for other things it's better value for money. Visio is too expensive for my taste, and now I've found Edraw there is no need for other products." I just wanted to write Edraw is great value for money! (It is very easy to use too!) Thanks."


