Activity Network Diagram
Contents
An Activity Network Diagram (AND) is also called an Arrow Diagram (because the pictorial display has arrows in it) or a PERT (Program Evaluation Review Technique) Diagram, and it is used for identifying time sequences of events that are pivotal to objectives. In Critical Path Analysis, this helps the teams to comprehend the specific event sequences driving time requirements for objective achievement. Activity Network Diagrams are also very useful when a project has multiple activities that need simultaneous management.
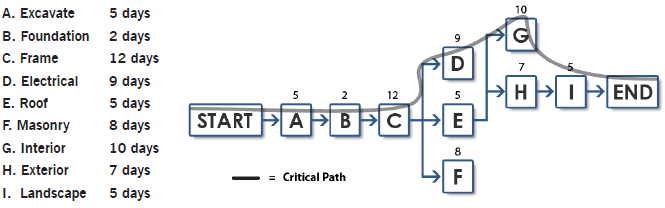
Image Source: www.sixsigmadaily.com
Activity Network Diagrams started out as an engineering and construction project management tool. Critical Path Analysis draws on this methodology to identify and standardize medical management activities.
An Activity Network Diagram helps to find out the most efficient sequence of events needed to complete any project. It enables you to create a realistic project schedule by graphically showing
- the total amount of time needed to complete the project
- the sequence in which tasks must be carried out
- which tasks can be carried out at the same time
- which are the critical tasks that you need to keep an eye on.
History of Activity Network Diagram
It was developed by the U.S. Department of Defense. It was first used as a management tool for military projects. It was Adapted as an educational tool for business managers.

An all-in-one platform for 210+ diagrams.
・ Simple alternative to Visio
・ 26k+ symbols
・ 10K+ free templates
・ 10+ AI diagram generators


Activity Network Diagram Symbols
In this section, we will know about the AND symbols. These symbols are used to complete the diagram by representing the network entities through the symbols. So, in order to make an activity network diagram, you should know these basic symbols.
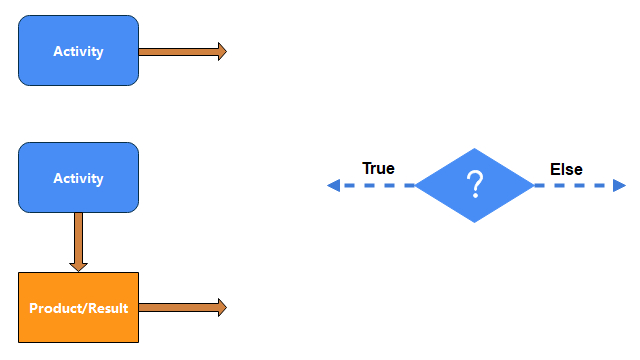
There are four symbols extensively used for the activity network diagram. They are as follows.
- Rectangle with rounded Corners: The rectangle with rounded corners depicts the activity in the network.
- Arrow: The arrow represents the sequence of activities connected together.
- Diamond: The diamond shape represents the logical answer of True or False and in binary, they are 0 or 1.
- Rectangle Box: It means that the successor activity finishes only when the predecessor activity finishes.
Activity Relationship Types
Activity dependency is the main topic in the Activity network diagram, making them the building blocks. The activities are always dependent on each other, making them perform based on taking permission from others.
Four types of relationships exist between two activities in the Activity Network diagram, and they are Finish-to-Start (FS), Start-to-Start (SS), Start-to-Finish (SF), and Finish-to-Finish (FF). Their short description is listed below.
- Finish-to-Start (FS): It means that the successor activity only starts after the predecessor activity finishes in the activity network diagram.
- Start-to-Start (SS): It simply shows that the successor activity will not start unless the predecessor activity starts.
- Start-to-Finish (SF): It means that the successor activity finishes when the predecessor activity starts.
- Finish-to-Finish (FF): It means that the successor activity finishes only when the predecessor activity finishes.
Pros and Cons of Activity Network Diagrams
This section will tell you the pros and cons of using the activity network diagram listed below.
Pros of using an Activity network diagram
- The Activity network diagram shows us that how the activities are related to each other, how they are initializing and stopping. The timings are also mentioned. So, the activity network diagram lets you measure the duration of the whole project.
- Due to the Activity network diagram, you have all the plans for the activities in a project. It makes you plan, organizes, and manage the project efficiently.
- The workflow in the Activity network diagram shows you how the activities work and are interconnected so. It lets you estimate how many activities are left to make your project complete.
- The Activity network diagram also tells you how much work has been done related to the activities and the project.
Cons of using an Activity network diagram
- These diagrams are time-consuming and take money to make. You have to consult the diagram maker to do this task.
- As the project grows, the diagram becomes more complex, and hence it is more vulnerable to errors.
Activity Network Diagram Examples
The concepts we learned above theoretically, now we will see them practically. Some of the examples of activity network diagrams are illustrated below.
Example 1: Activity Network Diagram
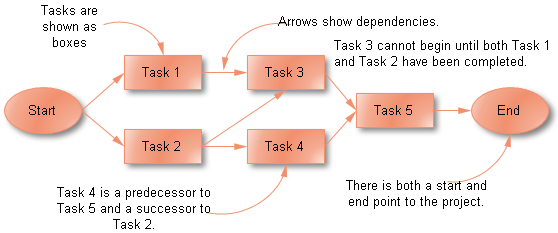
A project is composed of a set of actions or tasks which usually have some kind of interdependency. For example, before an axle can be turned, it must first be designed, the metal must be purchased, etc. This type of complex system is much easier to understand through the use of diagrams than through textual description, as actual interconnections between tasks can be shown. You can draw the activity network diagram easily with Edraw software.
The Activity Network diagram displays interdependencies between tasks through the use of boxes and arrows. Arrows pointing into a task box come from its predecessor tasks, which must be completed before the task can start. Arrows pointing out of a task box go to its successor tasks, which cannot start until at least this task is complete.
Example 2: AOA Network Diagram
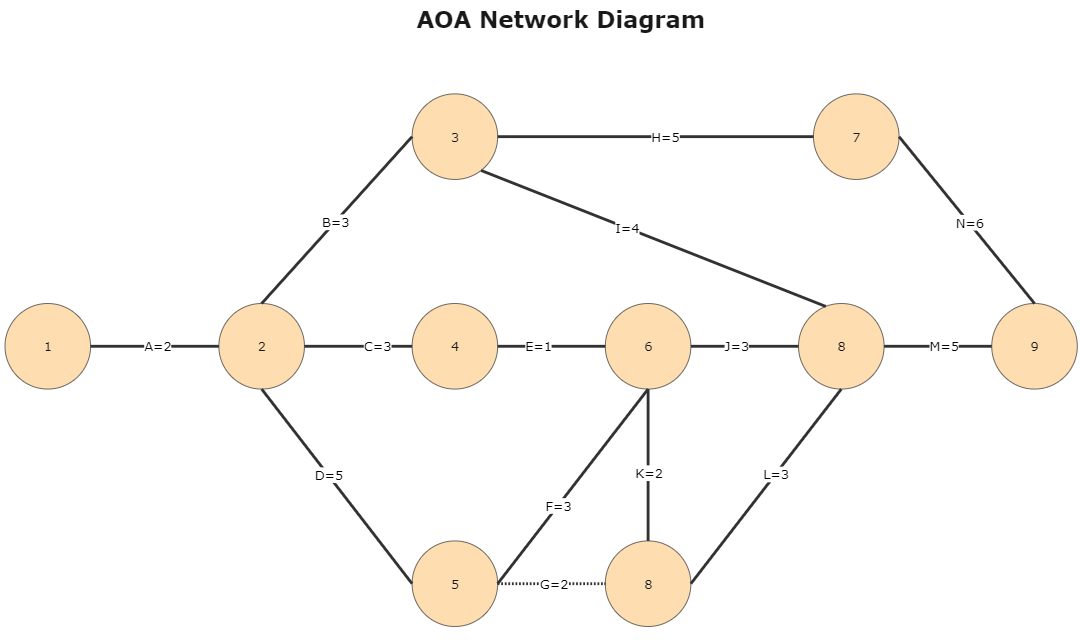
The above chart illustrates the AoA networking diagram, a networking mechanism that lets you calculate the progress of the task in a project. The diagram is used for CPM (Critical Path Method) and PERT (Program Evaluation and Review Technique). In the above example, the circles represent the tasks or evenings, and the lines show how each activity flows.
Example 3: Precedence diagram
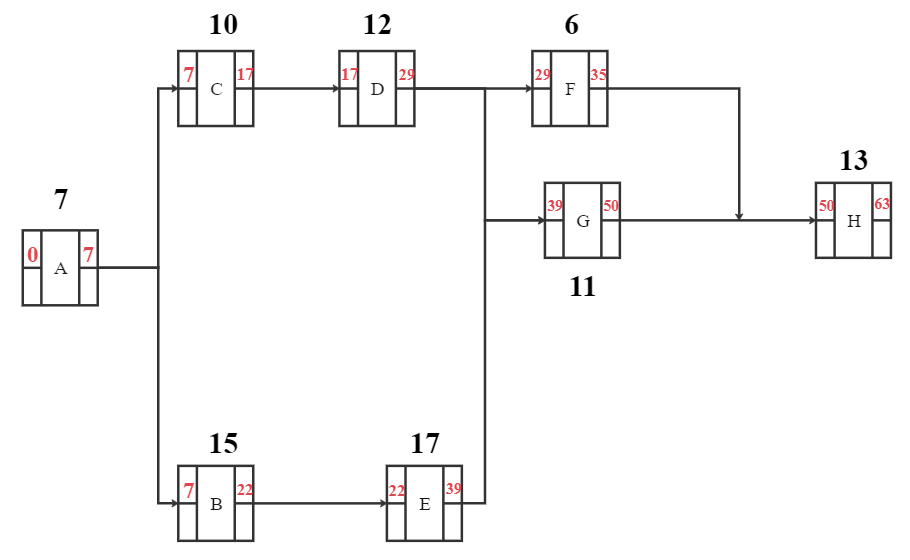
The precedence diagram is the tool for project managers that helps them form a scheduled network diagram for a project plan. In the above illustration, the boxes are the activities called nodes, and the lines connecting them show how the activities relate to each other.
How to Create an Activity Network Diagram?
In this section, we will know how the activity network diagram is made and some of the rules to make them.
Rules for Drawing Activity Network Diagrams
Follow the below rules to make your activity networking diagram save from the pitfalls and make it look complete and perfect.
- All the preceding activities must be completed before the project can begin.
- The arrows represent the logical precedence of the project.
- The two nodes should be connected with one activity that means every activity is depicted with one arrow.
- The activities should not have the same head and tail events.
- Give each activity a unique number. The head node (ending point) should be greater than the tail node (starting point).
- The arrows should not be intersected.
- Don't make the curved or bent arrows but straight.
- Every activity must have the predecessor and the successor activity except for the starting and ending points.
The Process of Making an Activity Network Diagram
The following points are the general process to make an activity network diagram. These points are capable of making a basic diagram.
Gather the Tasks
The first thing is to gather all the information about the tasks and list them accordingly.
The Chronological Order
Put all the tasks in chronological order. It means putting tasks B and C in front of task A if it needs both B and C to complete before it can be utilized.
Calculate the Time
Map the short, long, and overall time you need to complete a particular task and project.
Critical Path
The tasks executing in the planned order need time called the critical path. Calculate the critical path as the project would never be complete without it.
Re-evaluate the Stuff
Measure the things again to make the critical path shorter. Try to perform every measure inside your abilities to make the project complete in a shorter time.


