What is PERT Chart?
Two key components will push your project into the pains of accomplishment: extraordinary correspondence and great arranging. The first is cultivated by building a special report with your group through open channels of genuineness, modesty, and support. The second is welcomed on by authoritative abilities, group commitment, and prescience. Significantly, one primary apparatus in your project arranging multiple stockpiles is the PERT chart.
PERT charts are utilized by project managers to make realistic timetables by planning exercises and assessing their length by allocating three-time gauges for each (idealistic, probably, and critical). This makes PERT very valuable when arranging projects where the span of tasks is unsure.
What is a PERT Chart?
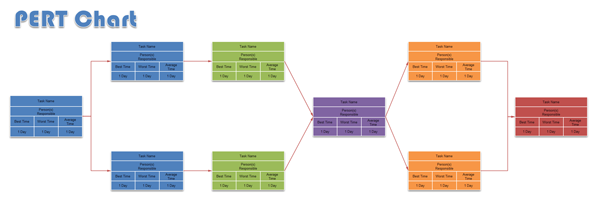
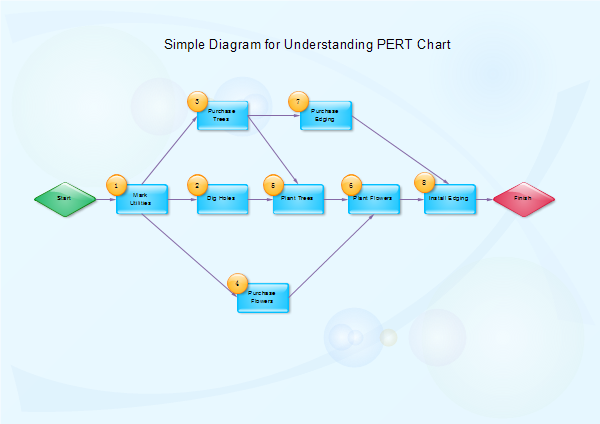
A PERT chart is a network diagram utilized in the Program Evaluation Review Technique (PERT) to address a project's course of events. It permits project managers to gauge the span of projects dependent on the analysis of task arrangements. A PERT chart network diagram incorporates numbered hubs, directional bolts, and different enhanced paradigm enhanced the PERT chart and lengthwise, while hubs are achievements.
The PERT chart model will permit you to see these components. The data created by a PERT chart can be brought into project booking programming. With programming, you can utilize a Gantt chart to make a valuable plan for getting work done, deal with your assets and follow through on schedule and under a financial plan.
Purpose and Benefit of Using PERT Charts
A PERT chart permits managers to assess the time and assets essential to deal with a project. This evaluation incorporates the capacity to follow required resources during any phase of creation throughout the whole project. PERT chart analysis fuses data and data from numerous divisions. This consolidating of data empowers office duty, and it recognizes all people in question across the association.
In addition, your group’s significant achievements permit an association to resolve projects that are pertinent to its essential situating. Utilizing a PERT chart can:
- Explain time imperatives for your group.
- Offer a definite perspective on the grouping in which tasks ought to be performed.
- Assist you with dealing with your time and assets across your group all the more viably.
- Diminish waste and expenses as you complete your project.
Maybe the most significant advantage of utilizing a PERT chart is the potential for higher specialist and customer fulfillment. When used successfully, the contextualized data in PERT charts can improve the dynamic interaction and give your group a feeling of responsibility regarding project prerequisites. This implies less pressure, fewer missed cutoff times, and more opportunities to get to your next project.
At last, PERT charts help imagine a scenario in which examinations. Understanding the potential outcomes concerning the progression of project assets and achievements permits management to accomplish the most effective and helpful project way.
Notations of PERT Charts
Task:A task should include name of the task, task ID, task duration, starting date and the ending date of the task.
Dependency:The time dependency relation will link and indicate the time frame of the compilation of the proceeding task on hand and the start of the next task of the project tasks.
Lanes:In PERT Chart, lanes help you arrange project base time for your chart by allowing you to separate the chart with lines and into horizontal zones. The horizontal zones represent the work and responsibilities of an assigned task, work, or planned concept for the group of functions.
What to Do before Creating a PERT Chart?
Since your project very likely will profit from the utilization of one of these diagrams, I've spread out six stages for effectively making a PERT chart. You'll discover the means in this interaction are the same as recognizing your fundamental way, which is incredibly useful since these diagrams are one strategy for outlining that way. More on that later.
- Make a list of the tasks and project achievements
- Make a sequence for the project tasks
- Determine the time standards for your tasks
Achievements, or deliverables, are somewhat similar to the designated spots in a hustling computer game. Each turn, pass, or immediately you drive are the tasks you perform to finish those designated spots. To make a PERT chart, you need to know the entirety of your group’s significant achievements and the tasks that will get that going. Rundown out these achievements and their tasks.
You've recorded the entirety of your achievements and tasks essential to finish your project, so now it's an ideal opportunity to place those tasks into the right arrangement for fruition. While setting up this arrangement and request of tasks, call attention to any task conditions.
This is the most technologically advanced PERT diagram creation measure. In case you're as of now acquainted with the fundamental way technique, you'll know there are three explicit time models you need to sort out for each task:
● Beginning date of the Task: This is the most punctual conceivable time you can start a task in your project. To decide the most punctual beginning date or time, you need to see the entirety of your task dependencies all around.
● Assessed finish date: This is the soonest possible time you desire to complete a specific task. This is dictated by including the entirety of the past subordinate advance occasions, including the term of this particular advance you are endeavoring to quantify.
● Time to finish: This is the length of time you plan on spending to complete every individual task.
Whenever you've decided every one of the three of these rules and drilled down the succession of your tasks, you're prepared to make your PERT chart.
How to Make PERT Chart in EdrawMax?
To create a PERT Diagram, here are things you need to know:
- List the steps required in a project and the time required to complete each event.
- Use the connectors to build the relationships between events.
- A line represents the time that each event takes. Each line should begin and end above the point on the time line that shows when the event that it leads to should begin and end.
- Each line should lead to a step that's dependent on the completion of the event that the line comes from. Thus, several lines may originate from one step or converge on one step.
Here are steps you can follow when you use a PERT chart tool- EdrawMax:

An all-in-one platform for 210+ diagrams.
・ Simple alternative to Visio
・ 26k+ symbols
・ 10K+ free templates
・ 10+ AI diagram generators


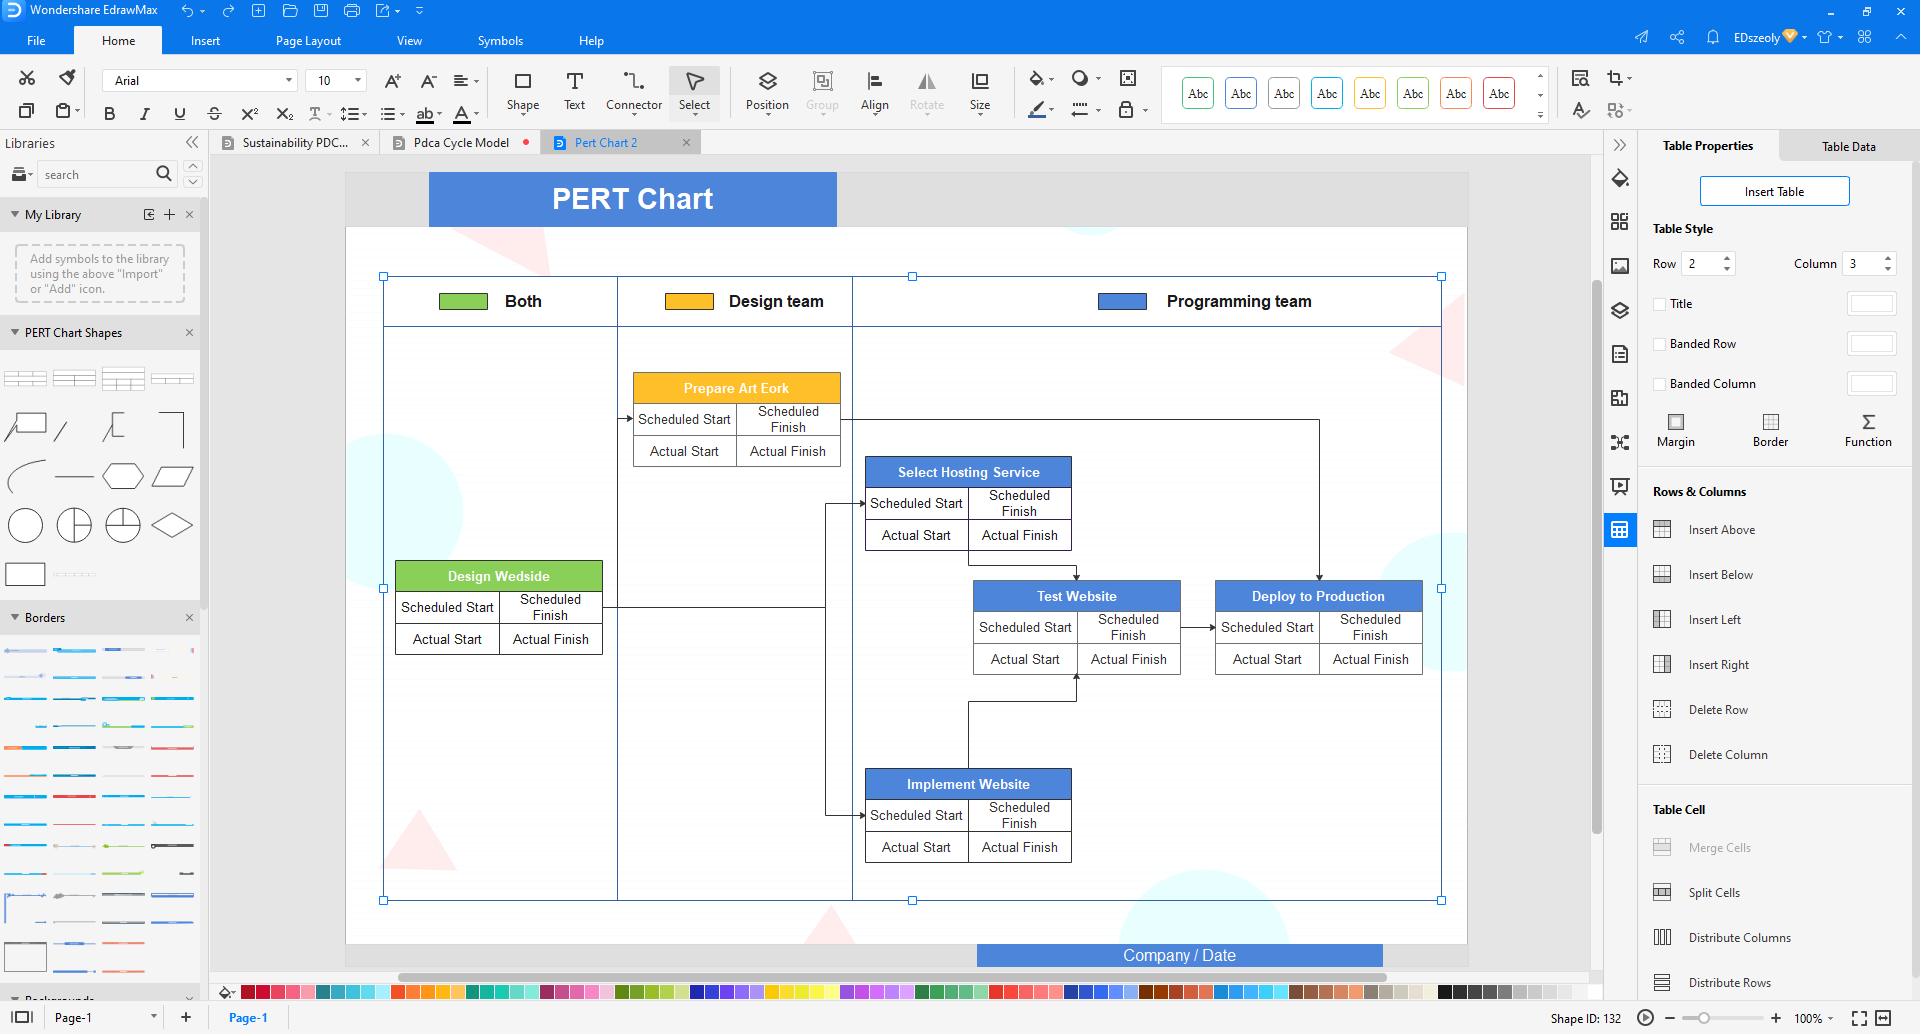
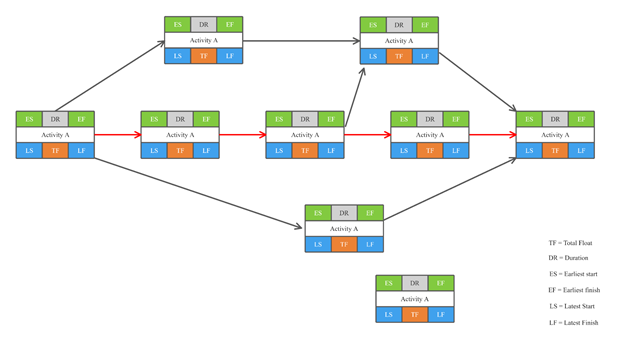
Step 1:Find and edit a PERT chart template from EdrawMax template center
Firstly, drag a PERT from the template. Click to change the Early Start, Late Start, Duration, Slack, etc.
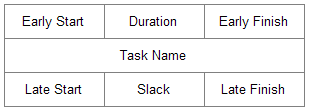
PERT Diagram usually includes a horizontal time line marked off in appropriate units, such as days or weeks. Another type of PERT diagram shows time required as a number above the arrow or dotted line.
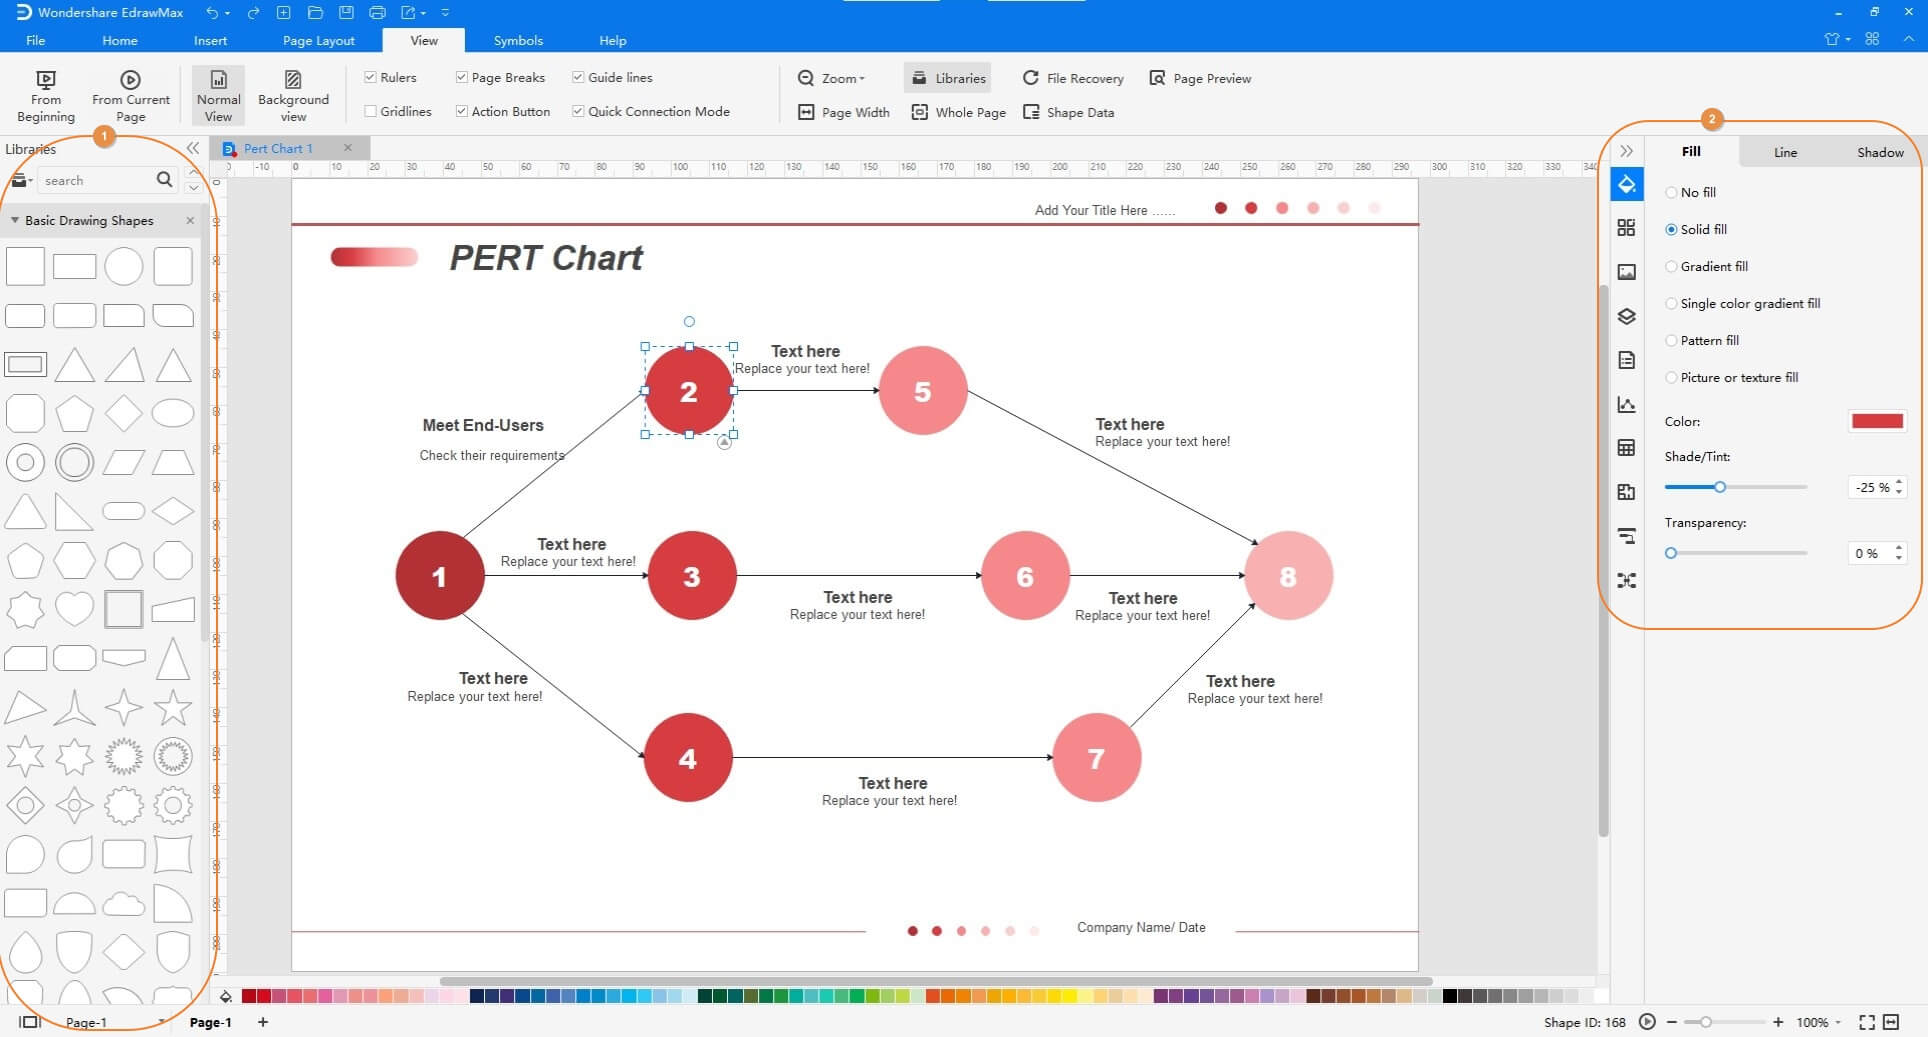
Step 2:Customize your PERT chart
A PERT diagram not only shows the relationship between simultaneous steps in a project, but it also shows the critical path, the sequence of tasks that need to be tracked carefully to finish the project on time.
You can switch to the Insert menu to add hyperlink and picture for the PERT. It's easy to change the PERT Chart Style with the Quick Style in the Home menu.
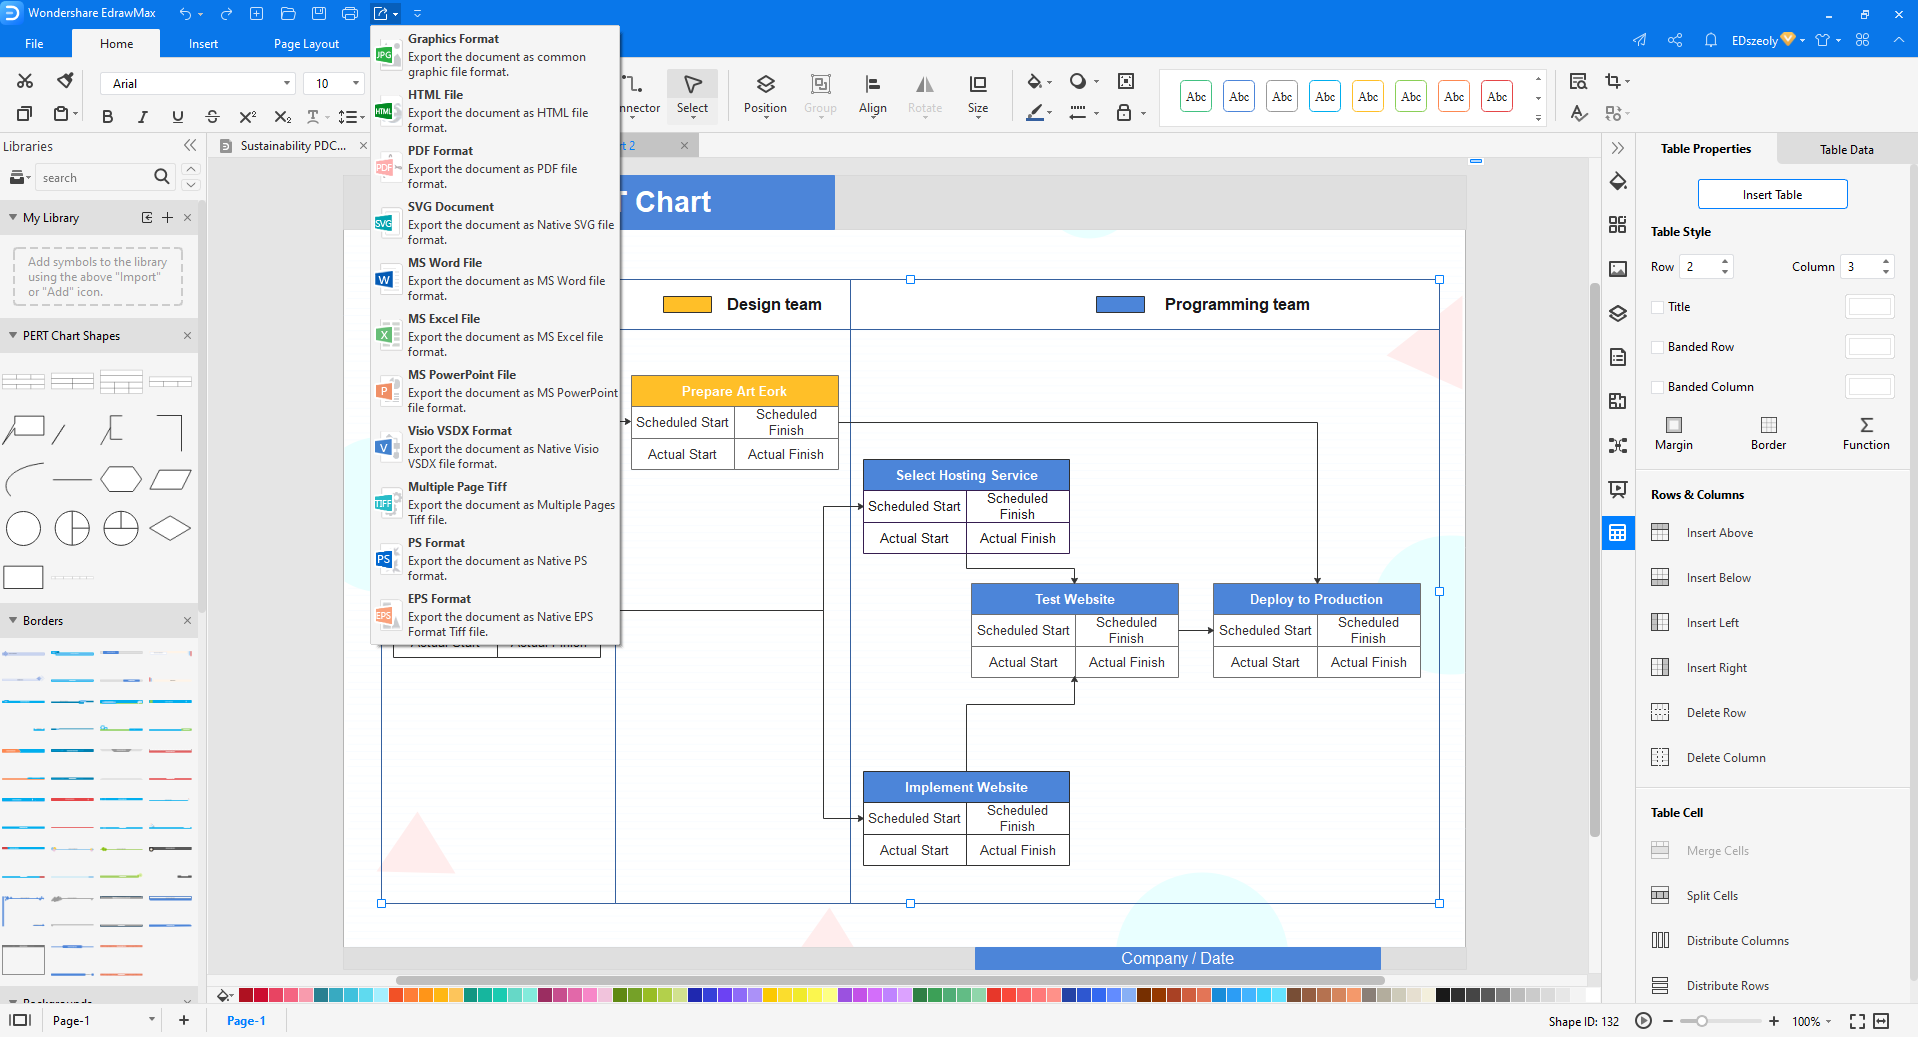
Step 3:Save and export your PERT chart
Once you are done making the chart, you can save and export it in any form you like.
PERT Chart Software
EdrawMax is a vector-based diagramming software with rich examples and templates. It has the tools to make it easy to create PERT charts for project or task management, timetables, work breakdown structures, critical path method, project lifecycles, goal setting, schedules and agendas.
Tip for Making PERT Chart
- Plan a reasonable schedule for project fulfillment.
- Finding out the fundamental way - since the way prompts the project’s base time, any postponements to these tasks will affect the finish of the general project.
- Recognize tasks that can be completed simultaneously.
- Distinguish tasks that should be packed if the general project time should be diminished.
- Identify slack time specific to arrange project tasks that are not as time-basic as the general cutoff time.
Assume a system analyst is attempting to set up a reasonable timetable for the information get-together and proposition periods of the framework's investigation and plan life cycle. The frameworks analyst investigates the circumstance and records exercises that should be refined en route and shaped a PERT Chart as follows:
More Project Management Examples
|
|
|
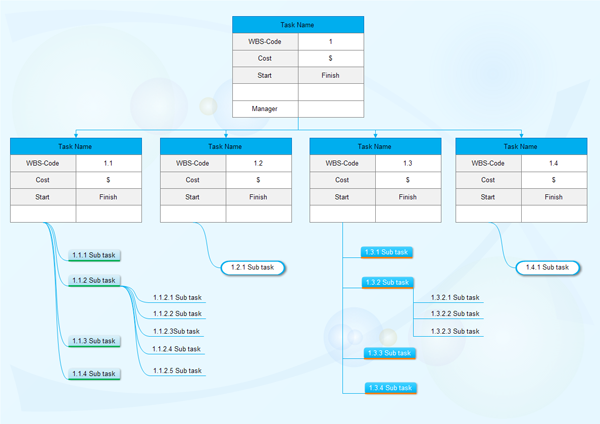
| WBS Diagram | Understand PERT CHART | Relations Diagram |
Read Also:


