List Drawing Software
Free Download List Drawing Software and View All Examples
Edraw Max includes lots of built-in list shapes for designers to draw commonly used list, block list, picture list and table list. Is there an easy list making software? I'm looking for a program that will let me generate a simple packing list that I can reuse every time I travel.
System Requirements
Works on Windows 7, 8, 10, XP, Vista and Citrix
Works on 32 and 64 bit Windows
Works on Mac OS X 10.2 or later
Amazing Advanced Software Features
- A complete, all-in-one diagramming tool
- An easy, effective infographics maker that even novices can handle without hassle
- Readily-available templates and examples to get started quickly
- Advanced formatting tools
- Easy theme options to add color and unique styles to diagrams
- Publish your creation online or print out in glorious high resolution
- Export, share your work in multiple formats (pdf, doc, pptx, etc.)
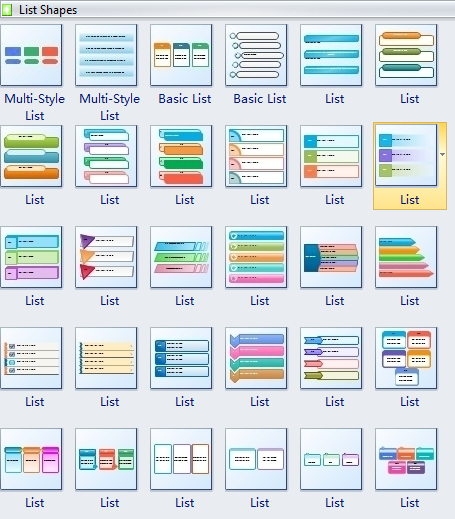
Built-in Shapes for Drawing List
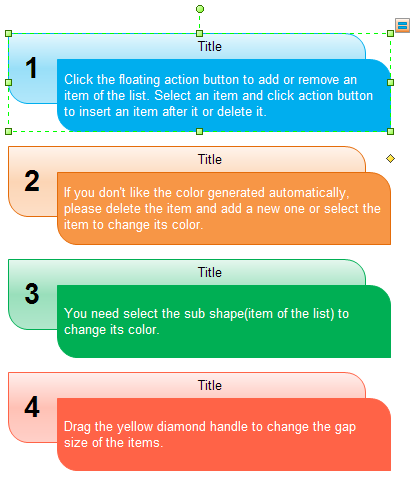
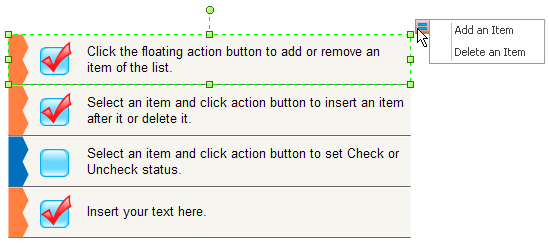
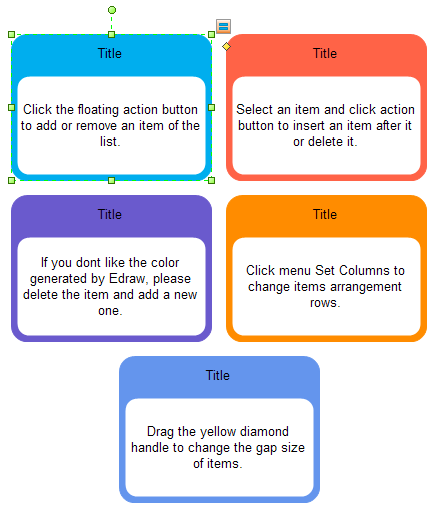
Edraw Max, a new list making software, can generate beautiful style lists easily. Just drag these list shapes to the canvas then click the action button to change them as you need.
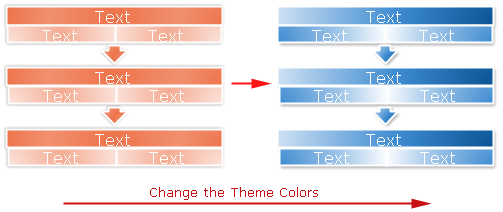
You can change the list theme that is applied by default in Edraw programs by selecting another predefined document theme or a custom document theme. Document themes that you apply immediately affect the styles that you can use in your document.
If you want to apply two different themes for two lists in a document. You need to protect the theme for a list firstly.
Prevent a List from using Theme Effects or Colors
- Select the shape.
- On the Shape Format tab, Click Protection.
- In the Protection menu list, check the From theme or From format.
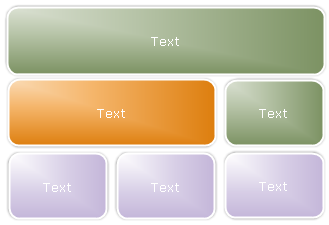
Basic Block List
Use to show non-sequential or grouped blocks of information. Maximizes both horizontal and vertical display space for shapes.
Grouped List
Used to show groups and sub-groups of information, or steps and sub-steps in a task, process, or workflow. Level 1 text corresponds to the top-level horizontal shapes, and Level 2 text corresponds to vertical sub-steps under each related top-level shape. It works well for emphasizing sub-groups or sub-steps, hierarchical information, or multiple lists of information.
Bending Picture Accent List
Use this kind of list to show non-sequential or grouped blocks of information. The small circular shapes are designed to contain pictures. They work well for illustrating both Level 1 and Level 2 text. They maximizes both horizontal and vertical display space for shapes.
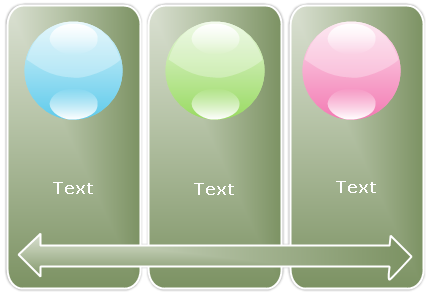
Continuous Picture List
It is applied to show groups of interconnected information. The circular shapes are designed to contain pictures.
Hierarchy List
You can use it to show hierarchical relationships progressing across groups. It can also be used to group or list information.
Picture List
It is for the show of non-sequential or grouped information with an emphasis on related pictures. The top shapes are designed to contain pictures.
Pyramid List
It is designed for presenting proportional, interconnected, or hierarchical relationships. Text appears in the rectangular shapes on top of the pyramid background.
Stacked List
Used to show groups of information or steps in a task, process, or workflow. Circular shapes contain Level 1 text, and the corresponding rectangles contain Level 2 text. Works well for numerous details and minimal Level 1 text.
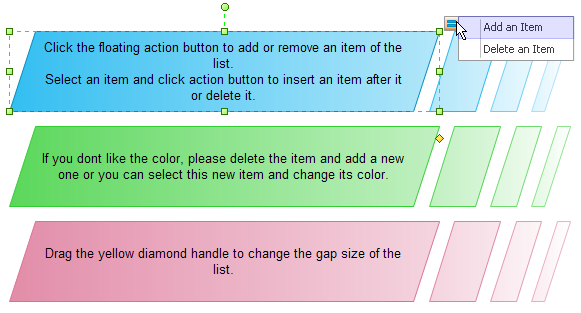
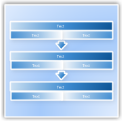
Table List
For showing grouped or related information of equal value. The first Level 1 line of text corresponds to the top shape and its Level 2 text is used for the subsequent lists.
Target List
Use it to show interrelated or overlapping information. Each of the first seven lines of Level 1 text appears in the rectangular shape. Unused text does not appear, but remains available if you switch layouts. Works well with both Level 1 and Level 2 text.
Trapezoid List
It is used to show grouped or related information of equal value. Works well with large amounts of text.
Vertical Arrow List
For displaying a progression or sequential steps in a task, process, or workflow that move toward a common goal. Works well for bulleted lists of information.
![]()
Chevron List
![]()
It is invented to show a progression or sequential steps in a task, process, or workflow, or to emphasize movement or direction. It emphasizes Level 2 text over Level 1 text, and is a good choice for large amounts of Level 2 text.
Vertical Picture List
It is ideal for showing non-sequential or grouped blocks of information. The small shapes on the left are designed to contain pictures.
List Diagram Examples
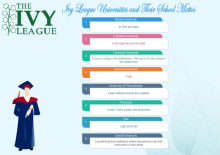
The Ivy League is a group of eight universities in the northeastern part of the United States, that have high academic and social status. See which are these universities in the right list diagram.
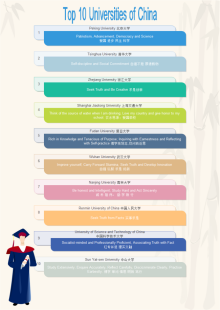
Top 10 universities of China are listed in order in the left diagram along with their mottos, in both Chinese and English. These mottos can not only be regarded as school mottos but life motto for all people.


