An Informative Guide to Data Flow Diagram (DFD)
Edraw Content Team
Do You Want to Make Your Data Flow Diagram?
EdrawMax specializes in diagramming and visualizing. Learn from this Data Flow Diagram complete guide to create your own Data Flow Diagram with our free templates. Just try it free now!
The daily systems and operations of an organization involve many strategies, each of which is equally important to the success of a task. But it can be difficult to remember every crucial detail of strategies without knowing the right methods. So, do you also find such difficulty? If yes, then you can easily keep your business organized if you know how to make a data flow diagram.
Read this article to learn how to make a data flow diagram (DFD) to apply it to your strategies. So, here we go!!
1. What is Data Flow Diagram (DFD)?
A Data Flow Diagram (DFD) shows how information moves visually through a system or process. It depicts the overall inputs, operations, and outputs of data in a system. The different outcomes take the form of shapes like rectangles and ovals, while lines and arrows denote the flows. The results are printed along the lines and shapes to keep the information logical and organized.
Purposes of a data flow diagram
- It assists in database management and system.
- DFD can also represent input and output entities outside of databases. It enables us to make comparisons with entities from the real world.
- The database's development, implementation, and deployment phases require engineers to make many decisions. By offering a comprehensive visual representation of the system, a DFD can help in our ability to make better decisions.
- If there is any problem in your system, then you can check the DFD. By doing so, you can find out any error and even resolve it in the long run.
2. Main Elements of Data Flow Diagram
The data flow diagram process has four major elements. So, let's see them:
- Entity
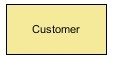
The source and destination of informational data is an entity. Rectangles are used to represent entities, and each one has a unique name. The edge of the diagram is where it is placed. Individuals, groups, or computer systems are all examples of entities. To show entities, a DFD uses stick figure drawings.
- Process
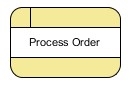
The process is an action that changes the flow of information and produces new output. A process can perform various tasks, such as computations, classifying data, or altering the flow using business rules. Circular or circular rectangles are used to represent actions and activities that have been performed on the data.
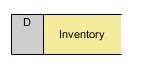
- Data Store
Data stores are the folders or storage spaces where information is kept and can be accessed later. They typically take the form of spreadsheets or database tables. Like processes, data stores have simple labels describing their function or hierarchy.
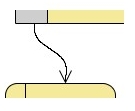
- Data Flow
Data flow is the line with arrows used to represent where the data flows. It illustrates the inputs and outputs as external entities design processes and engages with data stores. Data flow lines are a crucial component of a data flow diagram as they link all the information together. They are also labeled with brief descriptions of the goals of each data flow.
3. Levels of Data Flow Diagrams
DFDs can range from simple overviews to complex, level-by-level illustrations of a system or process, starting at level 0. The complexity of the diagram rises as the level does. Here are the three levels of data flow diagrams
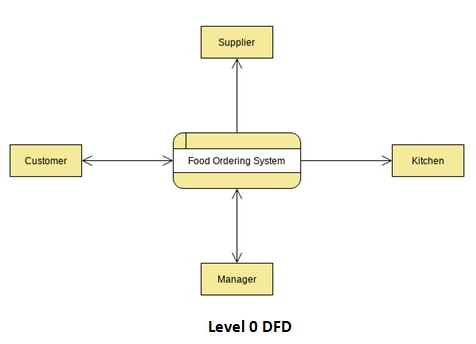
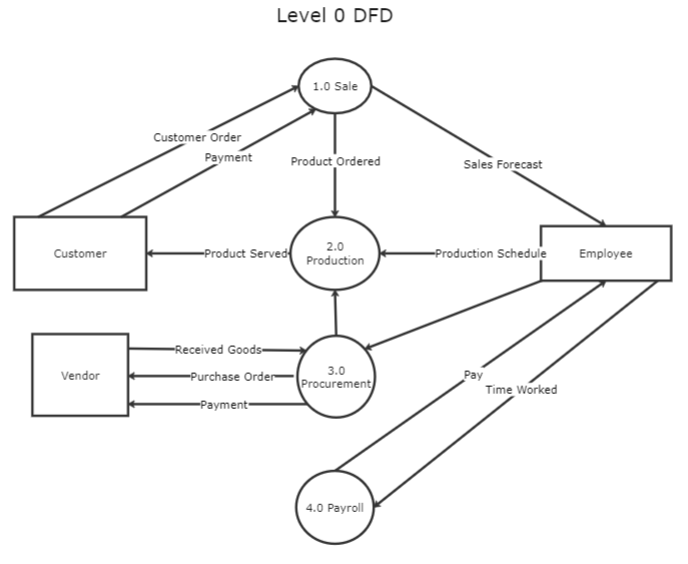
Level 0 DFD
The DFD level 0, also known as context diagrams, is the most typical and understandable DFDs. This DFD level primarily concerns high-level system operations and the data sources that flow to or from them.
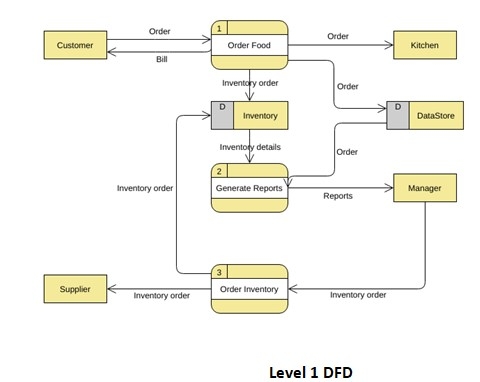
Level 1 DFD
The DFD level 1 provides a more in-depth look at the system by displaying the key sub-processes that comprise the system.
Level 2 DFD
Each level 1 process is divided into minutely detailed sub-processes in the next level of DFDs, which goes even further into detail. More text, symbols, and shapes are required to describe how the system works.
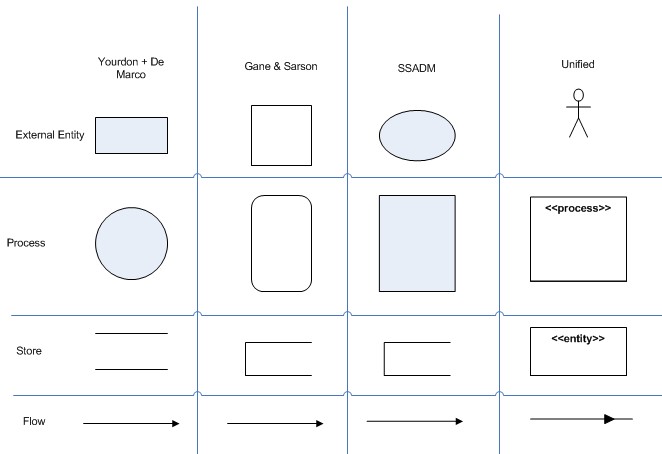
4. Symbols and Notations of Data Flow Diagrams
Depending on the methodology model used, DFD notions and symbols change. There are four different types of notations of data flow diagrams:
- Yourdon & Coad
- Gane & Sarson
- SSADM
- Unified
Data flow diagrams of the Yourdon and Coad types are more frequently used for information system visualization. However, DFDs of the Gane and Sarson types are used for system analysis and design.
They all use the same symbols to represent the four main elements of a DFD — external entity, process, data store, and data flow.
Learn More Data Flow Diagrams Symbols Details Here >>
5. How to Create a Data Flow Diagram?
Now you know everything about data flow diagrams, their symbols and notations, levels, and four elements. It’s time to know how to create a data flow diagram. So, here are the steps for making a DFD diagram:
Select the Process
Selecting the process is crucial because different processes use DFD at various levels. Keep in mind that it can be difficult to contextualize larger processes. So, you should identify and concentrate on the piece you want to master.
Arrange the Business Activities
The process’s activities must be divided into four categories: external entity, process, data flow, and data store.
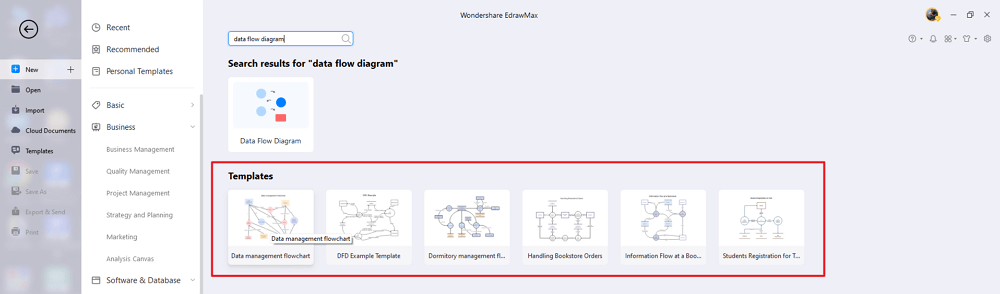
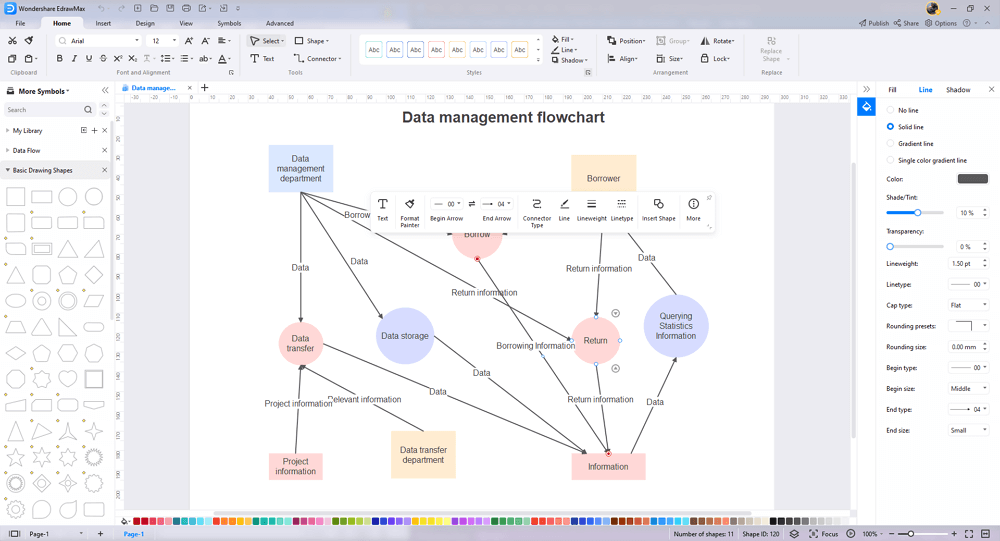
Make a Diagram
You can start drawing your DFD once the information has been organized neatly. You can make a DFD diagram in two ways: by hand or by using a template from EdrawMax.
Analyzing
Checking the quality of your work is always necessary. It would help if you looked for skipped steps, extraneous details, or needless complexity in this step.
Increasing and Creating Child Diagrams
You can begin working on the child diagram once you have finished the level 0 diagram. They will later serve as links between various processes.
6. Data Flow Diagram Examples
Now, let’s see the different data flow diagram examples.
- Level 0 DFD Template
- Level 1 Data Flow Diagram
- Data Flow Diagram for Hotel Management
- Logical Level Data Flow Diagram
- Customers Data Flow
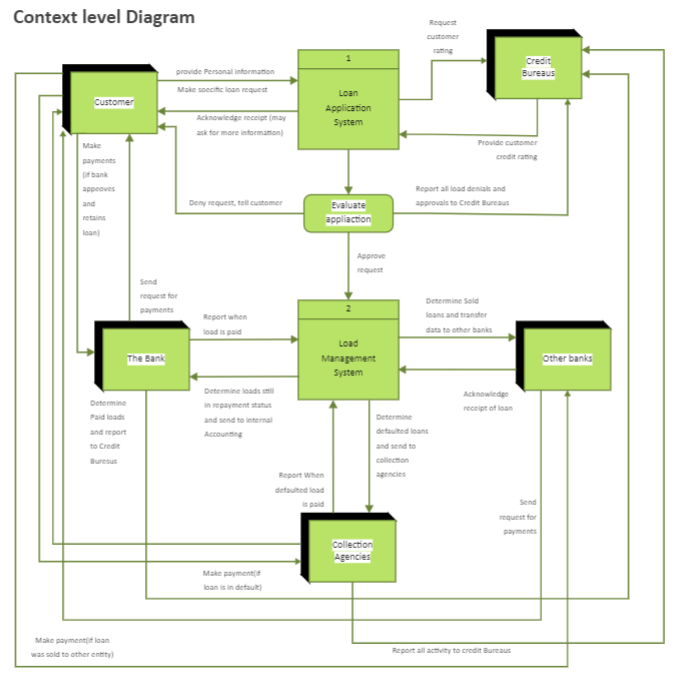
Level 0 DFD Template
A level 0 DFD represents how data moves throughout a system. A context diagram emphasizing how data interacts with external entities typically opens a level 0 DFD template.
Level 1 Data Flow Diagram
The primary functions of a system are highlighted in a level 1 data flow diagram. Draw a picture of how data is processed, received, and output. A level 1 DFD outlines the significant sub-processes that comprise the entire system.
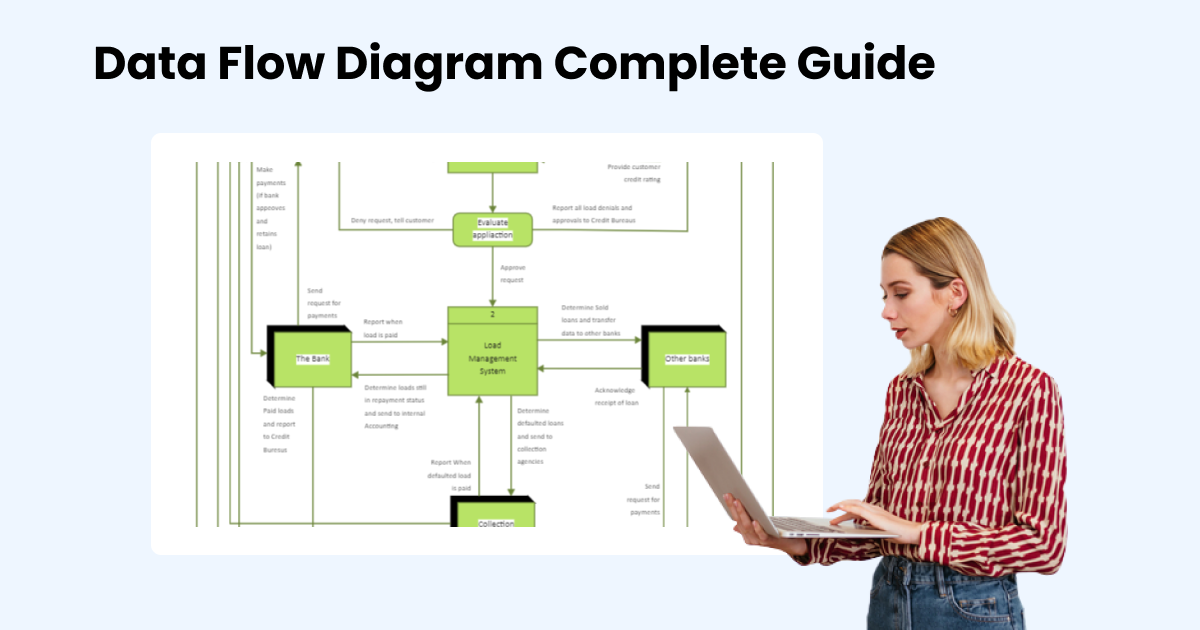
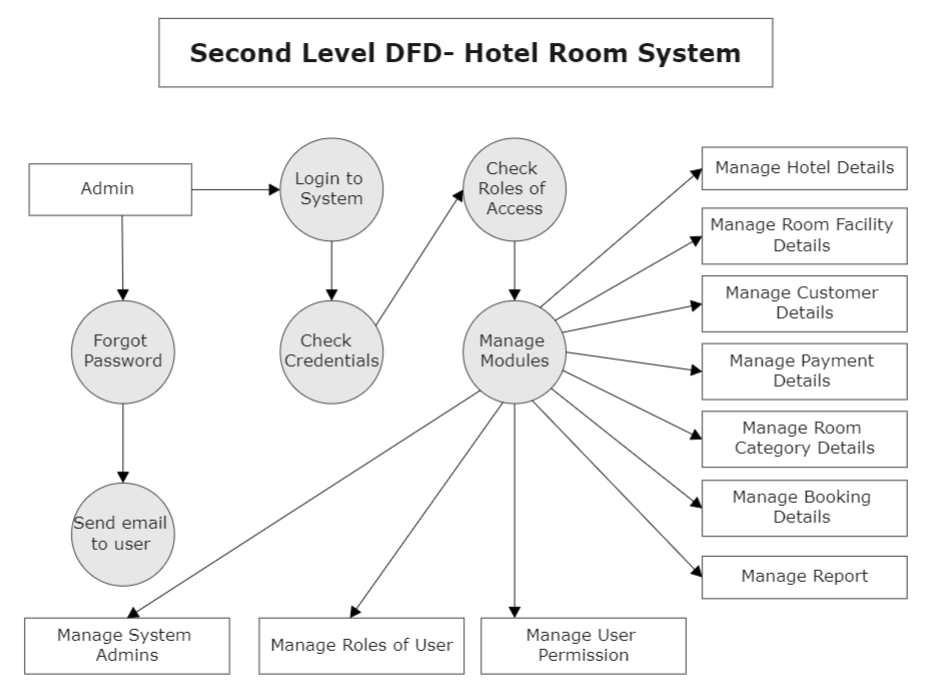
Data Flow Diagram for Hotel Management
This data flow diagram for hotel management shows the key operational procedures of the establishment. Apply effective strategies to help your hospitality business expand over time by using this data flow diagram.
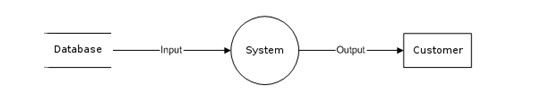
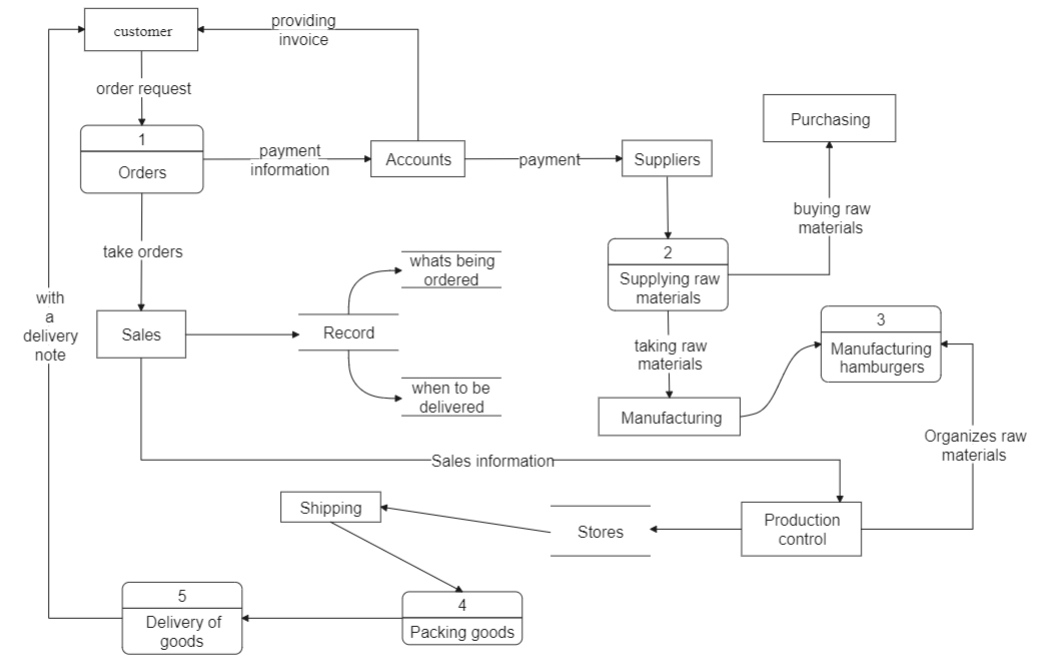
Customers Data Flow
This data-flow diagram example represents a single data element, such as the customer ID, a collection of data elements, or a data structure.
Get More Data Flow Diagram Examples Here >>
7. Data Flow Diagram Rules and Tips
While creating DFD diagrams, you must keep some rules in mind, which are mentioned below:
- There is no data transfer between the two data stores
A process must flow data from one data store to another process and vice versa. One data store to many processes can have data flow.
- A data flow between two entities is not possible
A process must flow data from one entity to another process and vice-versa. Between one entity and a process, there may be several data flows.
- A process should have at least one input and one output data flow
A process needs an input data flow to process data and an output data flow to send the processed data out into the world.
- Data flows can’t cross over one another.
- Every process in the system needs to be connected to at least one data store or another process.
A process must flow data from one data store to another process and vice versa. One data store to many processes can have data flow.
8. Conclusion
That's it! We hope you have understood what a data flow diagram is, its symbols and notations, and how to make a DFD. So, start putting DFDs to use to help your company stay organized. To create DFDs quickly, use a professional tool like EdrawMax. It has a user-friendly interface and a selection of several templates. Moreover, this tool provides you with a free version of the trial. Try out this amazing tool right now and be the judge yourself.

An all-in-one platform for 210+ diagrams.
・ Simple alternative to Visio
・ 26k+ symbols
・ 10K+ free templates
・ 10+ AI diagram generators


You May Also Like
Cycle Diagram Complete Guide
Knowledge
What is Mesh Topology
Knowledge
Matrix Org Chart Complete Guide
Knowledge


