What is a Flowchart
Do You Want to Create Your Flowchart?
EdrawMax specializes in diagramming and visualizing. Learn from this article to know everything about flowchart and create your own with ease. Just try it free now!
Part 1: What is Flowchart
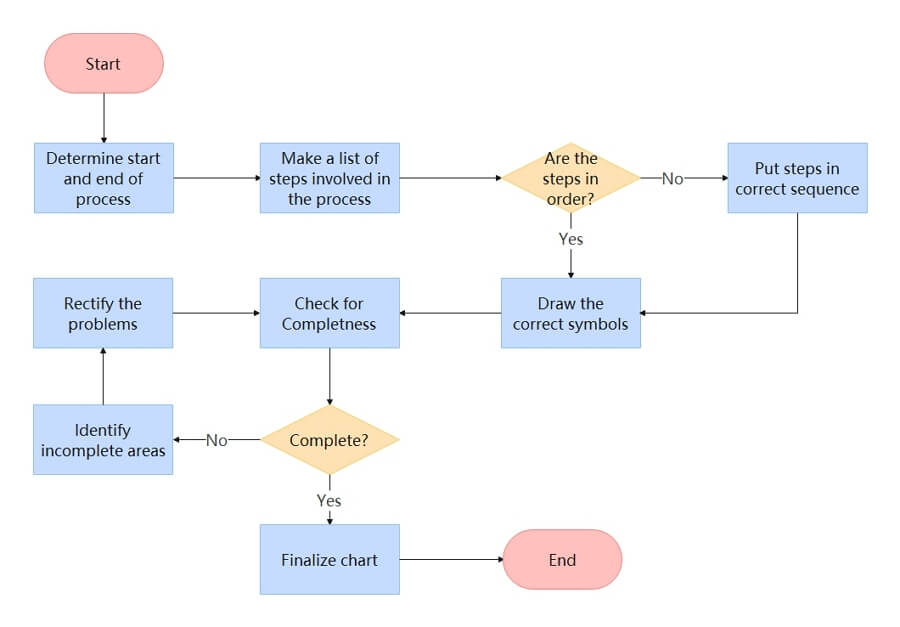
A flowchart is a graphical representation of steps of processes in chronological order. It is considered a generic tool since it has a wide variety of applications and can be used to illustrate several processes. For example, it can describe a project plan, service or an administrative process, or a manufacturing process.
Furthermore, a flowchart is one of the seven basic quality tools, and, therefore, it can be used as a process analysis tool.
Part 2: History of Flowchart
A presentation in 1921 by Frank and Lillian Gilbreth to members of the American Society of Mechanical Engineers (ASME) saw the introduction of the first process flowchart diagram. The presentation was on “Process Charts: First Steps in Finding the One Best Way to do Work.” After that, this tool was quickly adopted into industrial engineering curricula, with Allan H. Mogensen being the first person to train business people on how Gilbreth’s tool could simplify industrial processes and this was in the early 1930s.
In 1944, Art Spinanger and Ben S. Graham, the graduates of Mogensen’s class, influenced the further development of this tool. Spinanger established a thoughtful method to modify the program by taking it back to Procter and Gamble. Graham planned the application of the flow process chart to information processing. In 1947 ASME finally chose to adopt Gilbreth’s tool as the “ASME Standard tool” thus initiating the extensive growth in its popularity.
However, its growth in popularity started decreasing in the 1970s due to the rise of computer programmings tools, such as interactive computer terminals and third-generation programming languages. Flowcharts have, since then, improved and broaden, with charts like UML activity diagrams and Drakon-charts being considered flowcharts extensions. Despite the rise of computer algorithms, flowcharts are still being used to describe them.
Part 3: Symbols of Flowchar


To learn more flowchart symbols' details, go to this flowchart symbols guide.
Part 4: Advantages and Disadvantages of Flowchart
Using a flowchart to elaborate on some of the process steps in your company comes with its benefits and drawbacks. So, what are the advantages and disadvantages of using a flowchart?
Advantages:
-
Simplifies complex processes using graphical illustrations diagrams that are pretty easy to understand.
-
To document a process
-
It can be used as a basis of new processes when planning a project
-
It can be used to critically analyze, find and remove unnecessary delays, redundancies, and breakdowns in a system/process.
-
To help communicate to targeted individual, team, or department about how a process is done
-
To better communication for people involved in the same process
Disadvantages:
-
You can experience logic complexity when designing a relatively complex diagram
-
Flowchart alteration is quite a hassle, and this is because when a simple alteration or change is done to the process, you may need to redraw the chart entirely.
-
Recreating a flowchart is not that easy since you can type symbols and, more importantly, you need to know what each symbol means for each type of flowchart to design a flowchart effectively.
Part 5: Use Case of Flowchart
As said earlier, a flowchart is considered a general tool; therefore, it has wider application and fit for use in a different field, such as engineering, education, marketing, etc. So, let’s have a look and see how it is beneficial in some of these and several other fields:
• To create the daily routines for employees or to illustrate their tasks
• For process documentation when preparing for consolidation or sale
• To develop a product realization or business plane
• To describe order and procurement processes
• To create and help understand user paths in a website
The application of flowchart in the educational field is relatively more expansive than any other field and will try and name a few of them.
• To diagram a body process
• To aid in an oral presentation
• To create a lesson plan
• Used in film or literature to demonstrate character development
• To map diseases or disorders’ symptoms and their treatments
A flowchart diagram is also helpful in the engineering field and can be used in several ways, such as:
• To design and illustrate the new product or structure’s prototype phase
• Analyzing the structure and accessing its life cycle
• To illustrate chemical and plant processes as well as update it
• To visually show the flow of reverse-engineering process
• To chart system and process flow
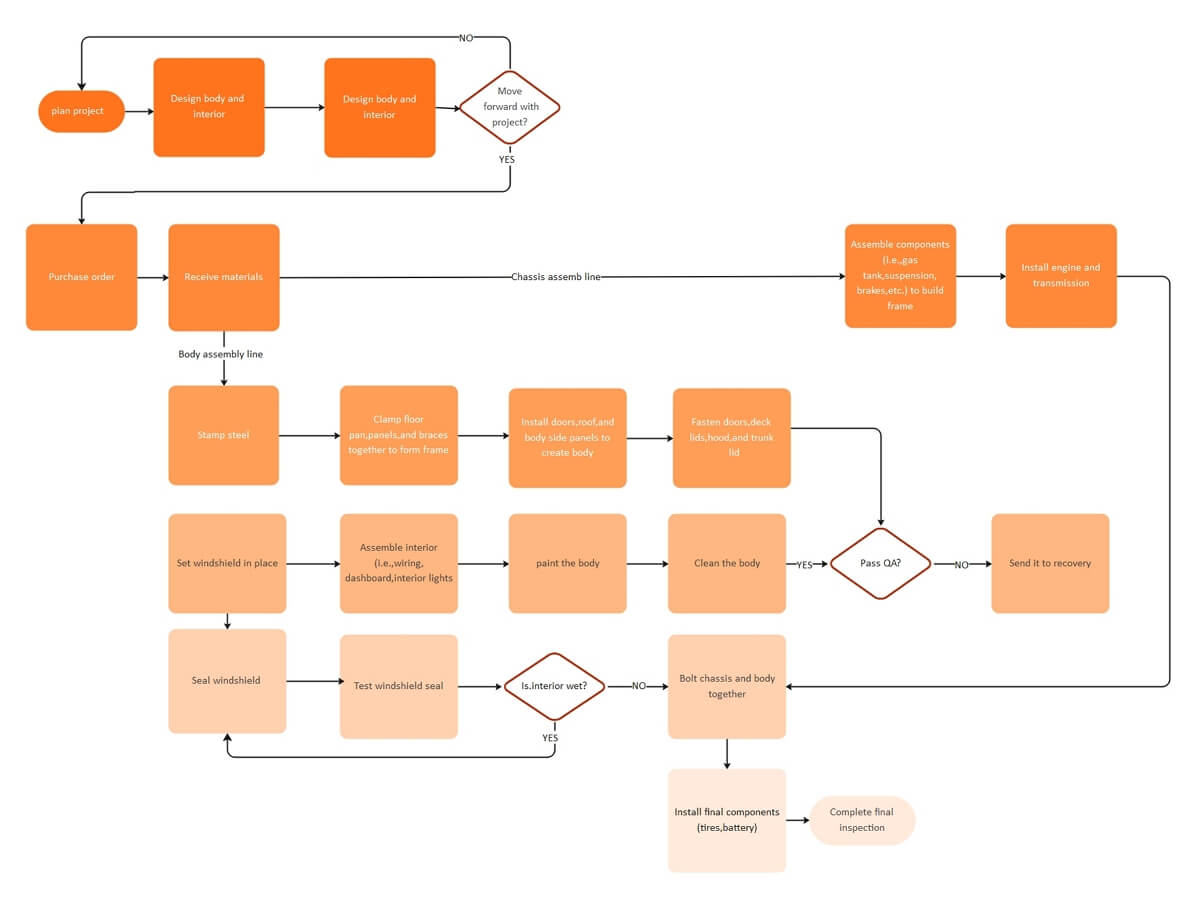
A flowchart can be used in the manufacturing field to accomplish different tasks, such as:
• To graphically illustrate steps involved manufacturing process from start to end.
• To study, determine and solve faults in procurement or manufacturing processes
You can utilize a flowchart diagram for sales and marketing of your product or service in several ways, i.e.:
• To discover and solve flows in the registration process
• To chart and analyze the impact and reach of different marketing strategies
• To illustrate the sales process
• To plan and research new marketing strategies

An all-in-one platform for 210+ diagrams.
・ Simple alternative to Visio
・ 26k+ symbols
・ 10K+ free templates
・ 10+ AI diagram generators


Part 6: What are the Types of Flowcharts?
Well, there are various types of flowcharts, and one type can be used for multiple purposes, i.e., business, technology, architecture, medicine, education, manufacturing, etc.
a) Document flowcharts: Shows document flow through a system.
b) Program flowcharts: Displays program within a system and its controls.
c) Data flowcharts: Displays data flow in a system and how it is controlled.
d) System flowcharts: Illustrates the physical or resource level and its controls.
However, there exist different flowchart classifications. This is according to several flowchart experts like Andrew Veronis, Marilyn Bohl, among others.
Part 7: Tips for Flowchart
Before you even things about designing a flowchart, there several key things you should consider, such as:
- Focus On your Audience:
If the chart you are planning to make is big and might take two or more pages, you should make it flow logically. To do this, you can use off-page or on-page connectors to edit your flowchart. With this, you can break up your diagram into separate pages but still have a nice flow.
- Choose the Best Suitable Diagram
Always choose the ideal type of chart to use depending on the kind of process and system you are planning to illustrate visually. For example, you can use a Swimlane diagram if a process you are diagramming spans through different groups, departments, or teams.
- Not the “Right Way” but the “Understandable Way.”
Most people tend to worry about perfecting their diagram in what they may consider the “right way or right format.” Be careful because perfection can be a trap sometimes; what you should mainly focus on when designing is the chart’s “comprehensibility.” Ensure it is easier for your readers to understand with no or minimal effort.
Other key factors include: Defining the process to diagramed and brainstorming the activities involved in it. You can utilize sticky notes for this.
Part 8: More Flowchart Templates
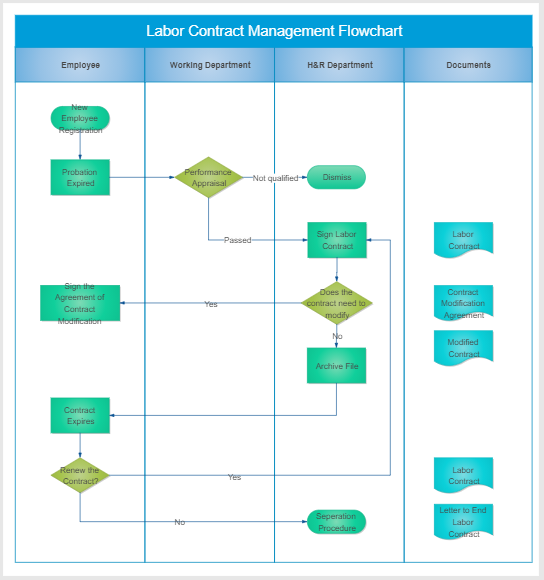
Labor Contract Management Flowchart Example
A labor contract is a legal agreement between an employer and employee. It describes the rules that will govern their relationships in different ways. Therefore, the Labor Contract Management flowchart below shows all steps followed when signing the first contract or renewing your contract. In this chart, we can notice the following key things are essential in flowcharts:
• Departments/group/sections: The flowchart is divided into four separate but interrelating departments/sections, including Employee, Working Department, H&R Department, and Documents
• Decision: There are three main decisions highlighted in this diagram. The decisions include:
Performance Appraisal – Passed/Not qualified
Does the contract need to modify? – Yes/No
Renew contract – Yes/No
• Start and End: A terminal symbol is used to illustrate the beginning and end of a process, and in this diagram, we can clearly see that.
• Documents: The documents in this process diagram represent the details of the contract, modification needed, Modified contract, labor contract, etc.
The following free flowchart templates and examples include the main categories for business and educational uses. Feel free to click on any of them to see more details.
 |
 |
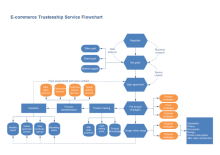 |
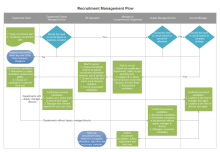
| Blank Flowchart Template | Recruitment Management Flowchart | E-commerce Flowchart Template |
 |
 |
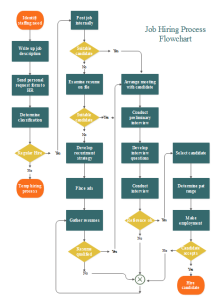
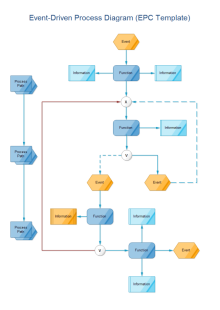 |
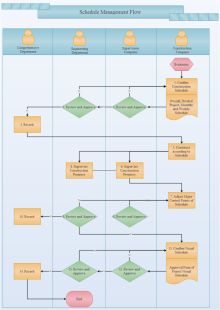
| Job Hiring Flowchart | Schedule Management Flowchart | Event Driven Process Flowchart |


