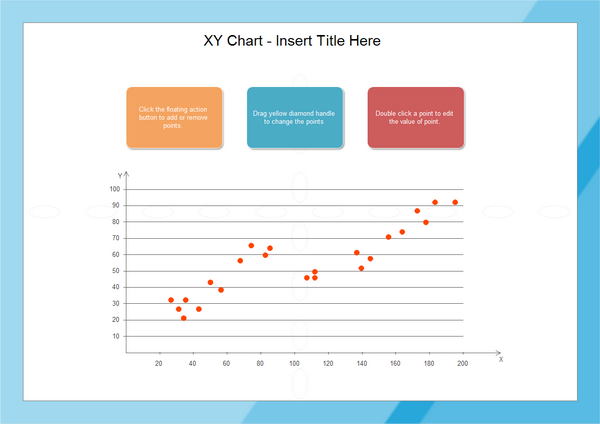
Chart Examples - XY Chart
The following example XY Chart combines values into single data points and displays them in uneven intervals, or clusters. XY Chart is often used for analyzing engineering, scientific and statistical data. When two or more values are compared, it is easy to measure the performance of each one and compare them at various intervals. This type of chart can show pronounced differences between principles, it can also measure commonalities for added insight.
The following example is created using Edraw vector drawing tool, which offers you the fastest and most convenient drawing method, allowing you to draw an XY chart in just minutes.
Click here to free download Edraw Charting Software. Then you can use the built-in templates to create and present XY charts and scatter chart in a short time.
The XY charts are used when there are two interdependent parameters to be shown on a chart.
Related Diagrams
|
|
|
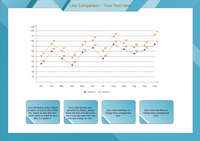
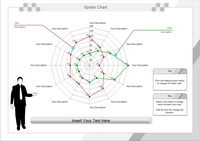
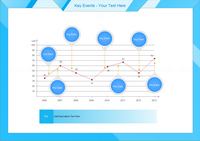
| Line Comparison | Spider Chart | Key Event |


