
 TL;DR:
Edraw permet de générer automatiquement des graphiques en secteur en chargeant un fichier de données directement dans des modèles vectoriels prédéfinis.
● L'utilisation de ce type de graphique doit se restreindre à six catégories maximum pour garantir l'interprétation visuelle correcte des tailles relatives des portions.
● La mise en forme visuelle optimale exige de colorer ou d'ombrer les tranches en appliquant un dégradé allant des tons les plus foncés pour la première part vers les tons les plus clairs pour la dernière.
● Le logiciel fournit des symboles techniques spécifiques manipulables par glisser-déposer, incluant le secteur 100 %, le secteur à plusieurs anneaux, l'anneau dégradé et les secteurs avec poignée de contrôle.
Demandez un résumé à l'IA
 ChatGPT
 Perplexity
 Gemini
 Claude
 Grok
Grok
Barres Histogramme Secteur Courbe Graphique en radar Nuage de points Graphique en aires Bulles Jauges Graphique en anneau Tableau de comparison
Graphique en secteur
A pie chart (or pie graph) is a specialized circular chart with different sectors, used in statistics, illustrating numerical proportion. A wedge of the circle represents each category's contribution, such that the graph resembles a pie that has been cut into different sized slices. Every 1% contribution that a category contributes to the total corresponds to a slice with an angle of 360 degrees. It is helpful to color or shade the different slices so that they grade from dark to light tones as you move from the first to the last slice. Pie charts are very widely used in the business world and the mass media. One thing you should pay attention to is that pie charts are good for displaying data for around 6 categories or fewer. When there are more categories it is difficult for the eye to distinguish between the relative sizes of the different sectors and so the chart becomes difficult to interpret.
Pie Chart Software
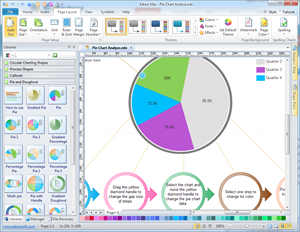
Using Edraw pie chart tools, you can create a good-looking and professional pie chart fast and easily. It provides a wide variety of unique charting styles and a rich set of powerful editing tools. Simply drag and drop pre-drawn templates and customize through color, size and line setting. You can directly load a data file through the action button, then the software will automatically generate a pie chart for you, which is really fast and convenient! A good looking pie chart could be done in just minutes.
Video Tutorial - How to Create a Pie Chart
Download Pie Chart Software
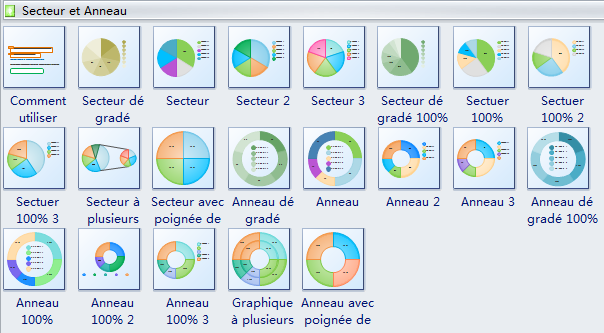
Symboles de graphique en secteur
Logiciel Edraw vous offre beaucoup de formes spéciales de secteur et d'anneau, telles que le secteur dégradé, le secteur 100%, le secteur à plusieurs anneaux, l'anneau dégradé, les secteurs avec poignée, l'anneau dégradé 100%, le secteur avec poignée de contrôle, etc. Toutes ces formes vous permettront de dessiner un merveilleux diagramme.
Modèle de graphique en secteur
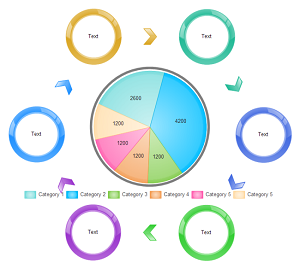
Ce joli modèle en étoile est bien préparé pour bénéficier nos utilisateurs. Vous pouvez avoir un démarrage rapide en utilisant ce fichier vectoriel comme un modèle.
Graphique en secteur de rapport d'affaires

Ce modèle de graphique en secteur prêt à utiliser sera très pratique et utile dans vos présentations de rapport d'activité.
Graphique à plusieurs secteurs - Plan de marketing
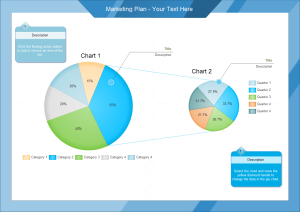
Un exemple de graphique en secteur vectoriel est facilement disponible pour télécharger. Vous allez économiser beaucoup de temps à l'aide de ce modèle pré-dessiné.

Simple. Intelligent. Des diagrammes étonnants pour chaque idée.