Simple Chart and Graph Maker
Make all common graphs with a vast collection of free templates. Create a slideshow within EdrawMax.
Trusted By Over 30 Million Users & Leading Brands


Why EdrawMax to Make Your Charts and Graphs?
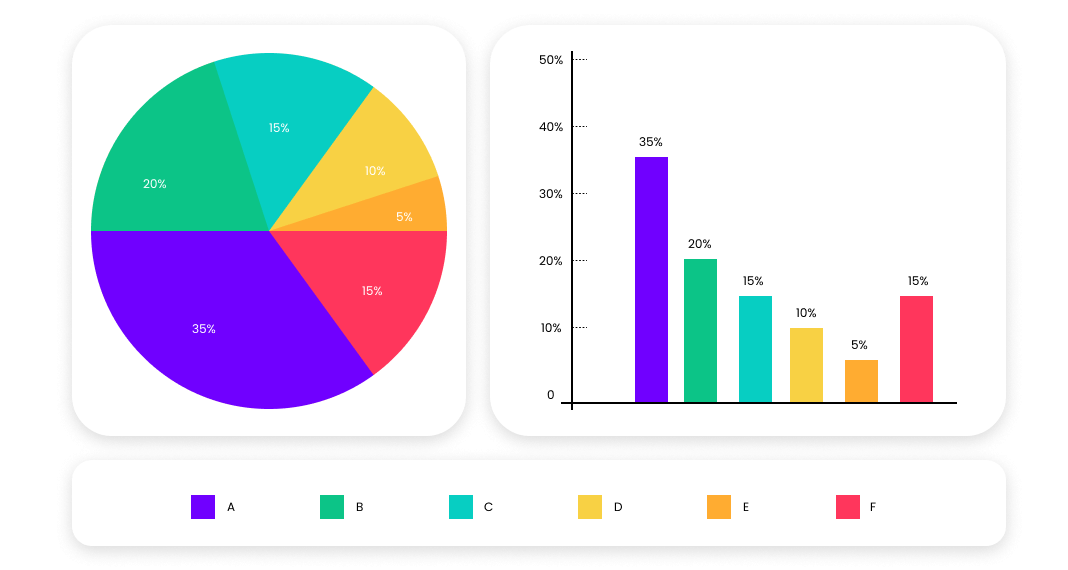
Visual representation of
your data
Clicks away from
your success
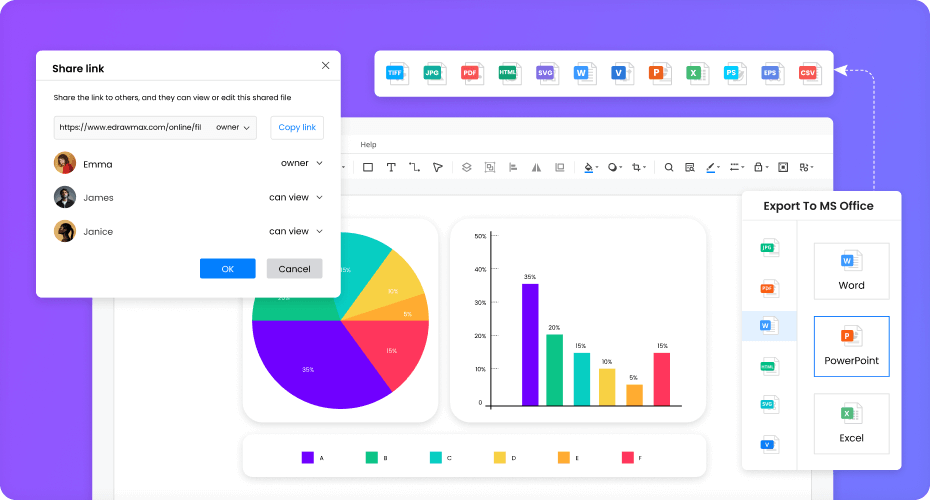
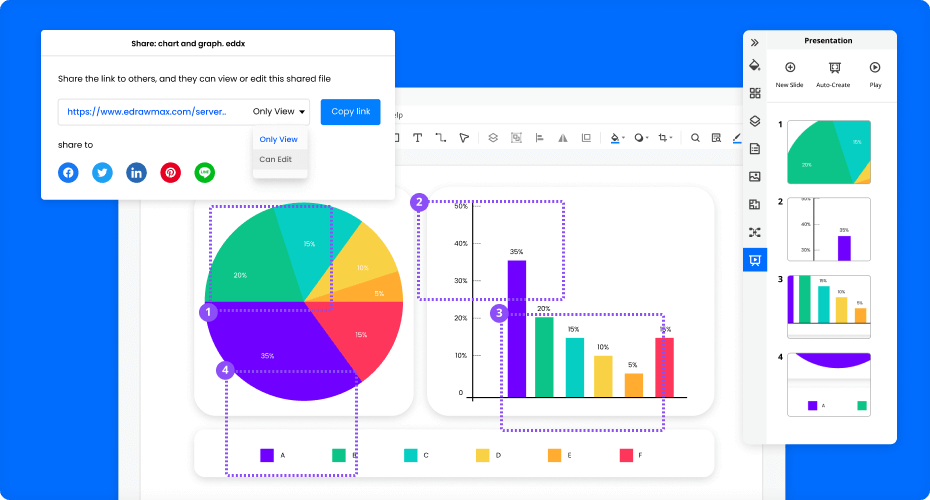
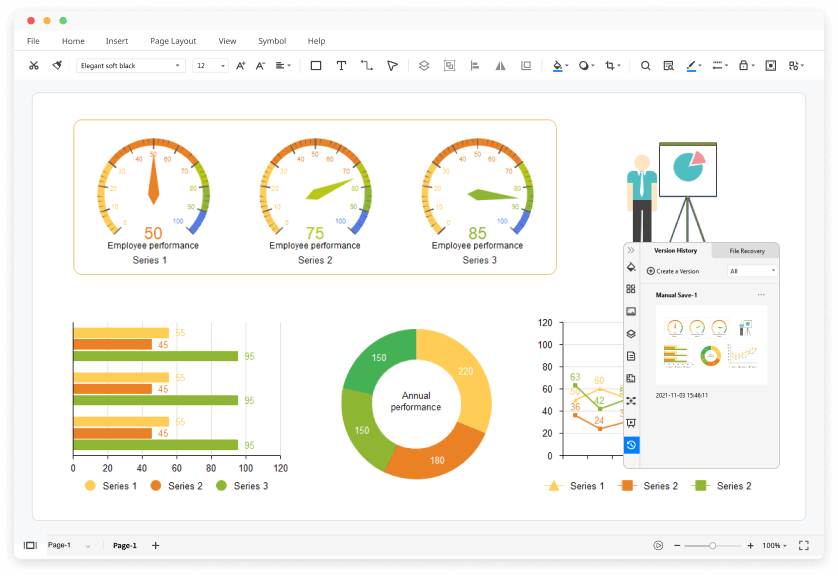
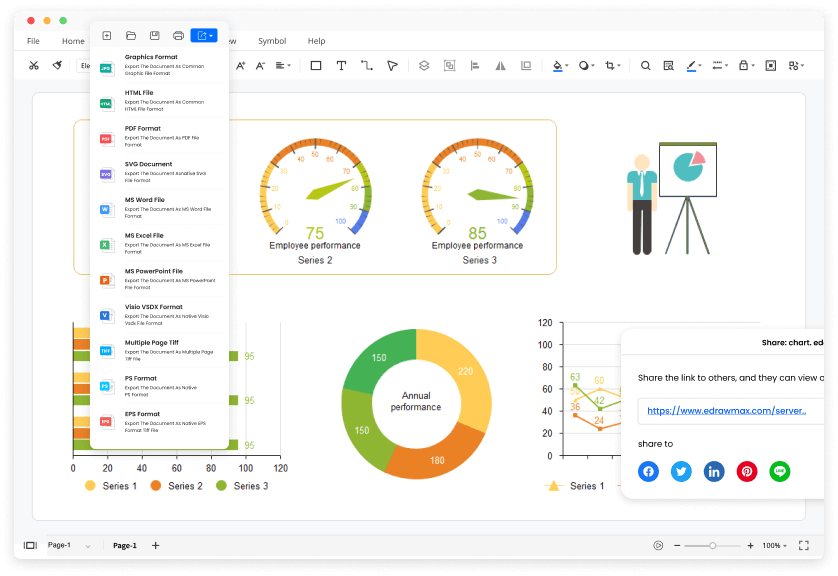
Export and share
without limits
Present and print in style
More Features Of Chart and Graph Maker
Visio file import and export
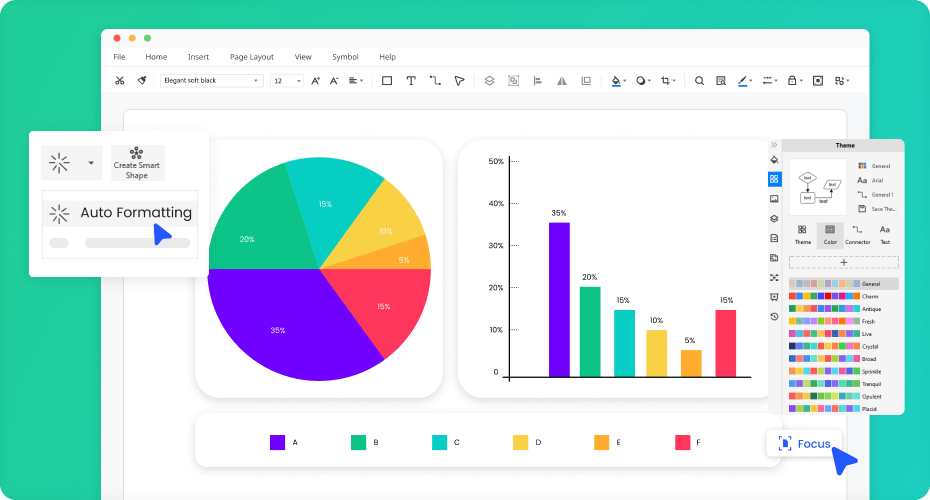
Customized fonts and shapes
Insert images and attachments
Infinitive canvas
Various color themes
File encryption and backup
How to Make a Chart and Graph?
Edraw Chart and Graph Templates
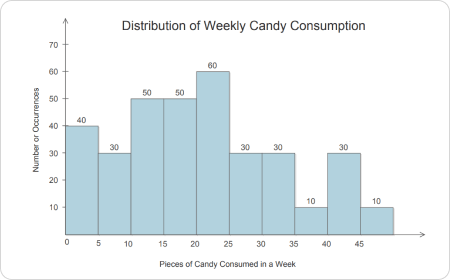
Histogram Example
Histogram example is used for variables whose values are numerical and measured on an interval scale.
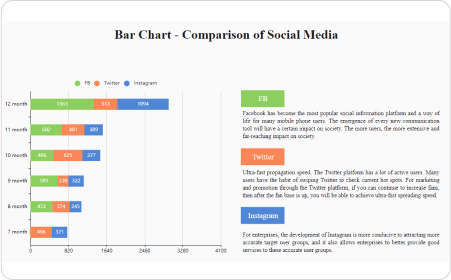
Bar Graph Example
A bar graph template is a graph that represents the categorical data using rectangular bars.
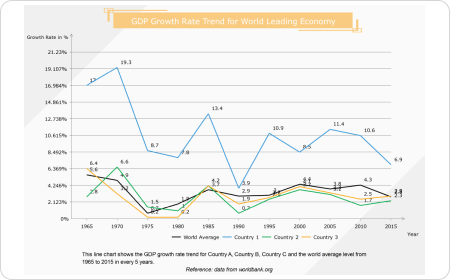
Line Graph Example
Line graph examples depict a graph that is used to display change over time as a series of data points connected by straight line segments on two axes.
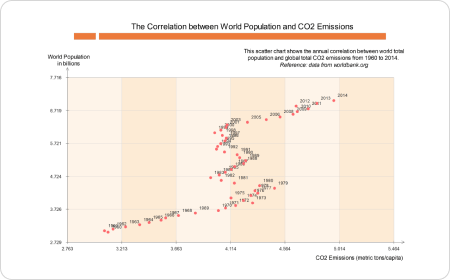
Scatter Plot Example
The scatter plot examples pairs of numerical data, with one variable on each axis, to look for a relationship between them.
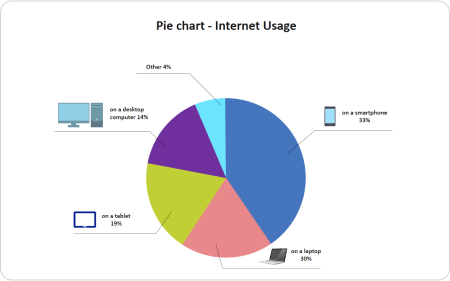
Pie Chart Example
Pie chart examples show how pie charts are used in data handling and are circular charts divided up into segments, with each representing a value.
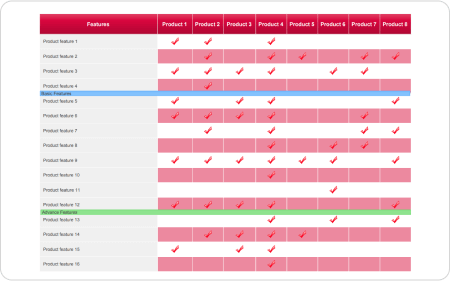
Comparison Chart Template
A comparison chart example is a chart that draws a comparison between two or more products on different parameters.
Chart and Graph FAQs

Does EdrawMax have any free chart and graph templates?
Except for the pre-made chart and graph templates in EdrawMax, you can download and customize chart and graph templates from our Template Community. All the community-made chart and graph templates are free to use for Edrawers.
How can I share my chart and graph with others who don't use EdrawMax?
When your chart is complete, you can post it on social media, publish on Edraw Template Community, or export the file as Word, Excel, PowerPoint, Visio, PDF, SVG, PNG and JPG. EdrawMax is dedicated to delivering a superior user experience.
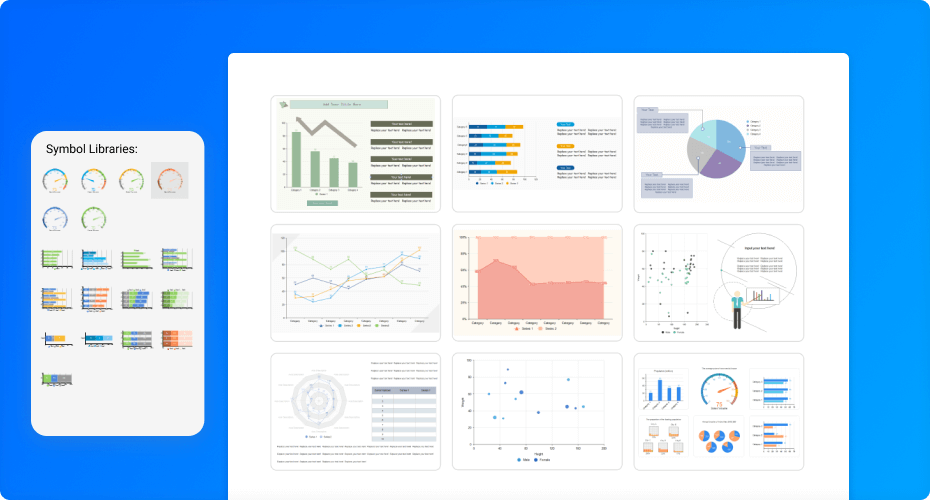
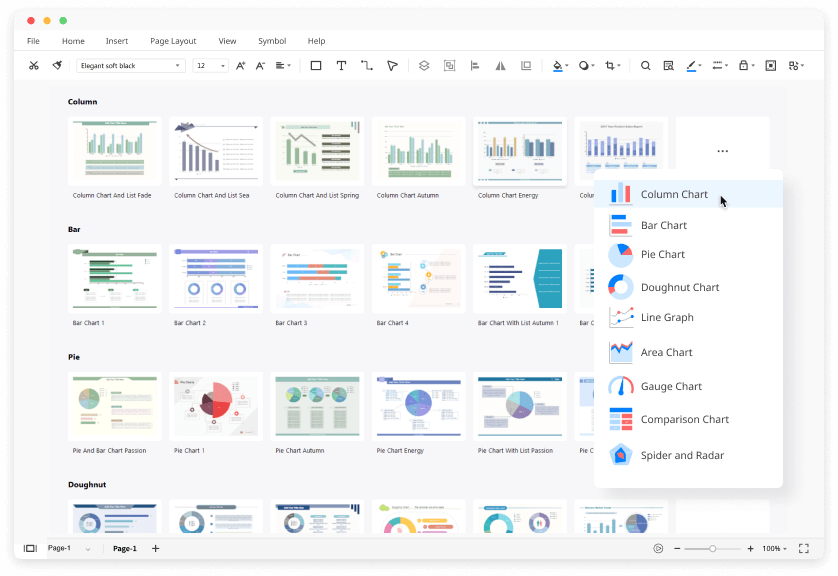
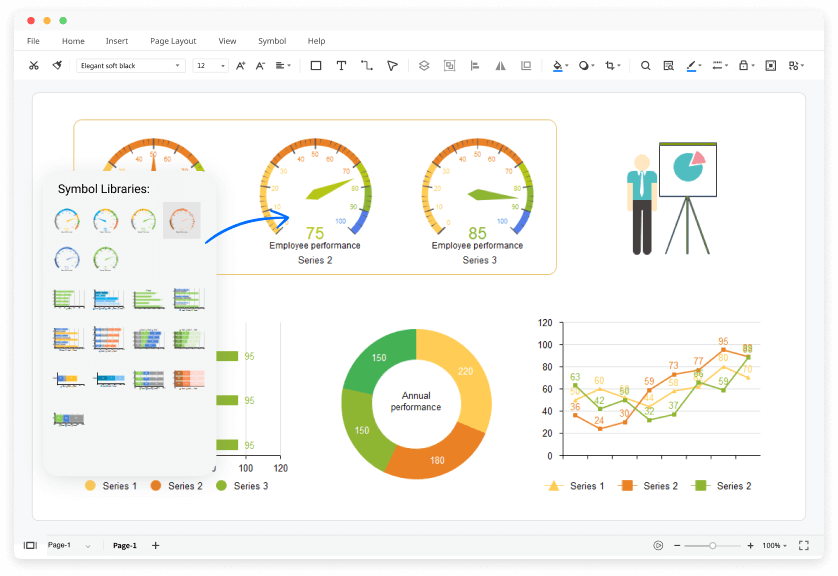
How can I find chart and graph symbols that I need?
No worries. You can find chart and graph symbols by looking for "Graphs and Charts" in the long menu of symbol libraries. You will see all the pre-made genogram symbols in EdrawMax.
How can I create a chart from scratch?
You can create a chart from scratch by dragging and dropping chart symbols from the libraries. Alternatively, you can navigate to the Insert tab and choose Chart. There you can select the chart that you like and add it into the canvas.
Is EdrawMax’s chart and graph maker free?
YES! It is free to create different charts and graphs in EdrawMax. There are free templates and symbols for making charts and graphs. Just download it and try EdrawMax now. You will love it right now.
More Resources
Unlock your diagram possibilities by exploring more diagram makers here.
Find more ideas, tips and knowledge to help create charts and graphs.
Need help? Find the instruction or contact support here.
