Edraw Centre de Soutien
Obtenez des réponses rapides et des instructions étape par étape.
Gantt Chart View and Options
Use Gantt Chart View
Gantt chart is effective for monitoring project status and progress. You can manage task information directly in the Gantt Chart view.
- Click the Task tab on the Ribbon.
- Click the Gant Chart button to create a Gantt Chart.
Modify Task Info in Gantt View
Each task is presented as a taskbar in the Gantt Chart. You can move or drag a taskbar to change its start and end date. You can also build task dependency in the Gantt Chart view.
- Rename a Task
- Change Task Start and End Date
- Build a Task Dependency
- Change the Date Unit
Double-click the cell in the Task Name column to rename the task.
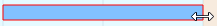
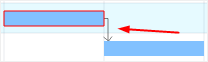
Drag the right border of the bar to change the bar length. You can also select and move the whole bar to change its position on the calendar.
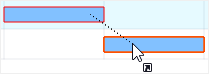
Click on a taskbar, then hold the mouse and drag it to another taskbar to build a relationship.
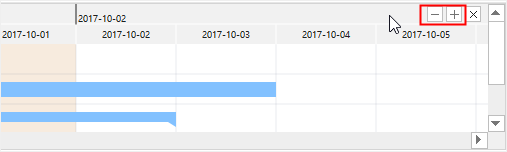
Click the “+” and “-” button on the top right corner to change the date unit.
Set Gantt Chart Options
You can set many task details such as date formats, major and minor units, workdays, start and finish time, etc. Simply follow the below steps to set your Gantt chart.
- Click the Gantt Option button in the Task tab.
- You can set the following options for your Gantt chart.
a.Select a date format in the drop-down menu.
b.Tick the workdays from Monday to Sunday.
c.Select the Major Unit and the Minor Unit in the corresponding drop-down menu.
d.Set the Task Duration in the corresponding drop-down menu.
e.Set the Start Date/Time and the Finish Date/Time in the corresponding drop-down menu.
Set Milestone
If tasks are set, you are allowed to set milestones for your tasks. Go to the Task tab on the ribbon and click the Milestone button, then the selected taskbar will be shifted to a diamond shape icon.


