Edraw Support Center
Get quick answers and step-by-step instructions in our support center.
Make Gantt Charts
The Gantt Chart is useful for monitoring project status and process with visual taskbars. You can modify and manage task information directly in the Gantt chart view. When you edit the task details in the Gantt chart, the related information will also be changed on the mind map.
Switch to Gantt Chart Mode
To open the Gantt chart pane in MindMaster, you can
- Go to Advanced tab and click Gantt Chart button.
- Navigate to Task pane and click Create Gantt Chart button.
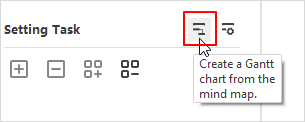
Click any of the above buttons again and you can close Gantt Chart pane.
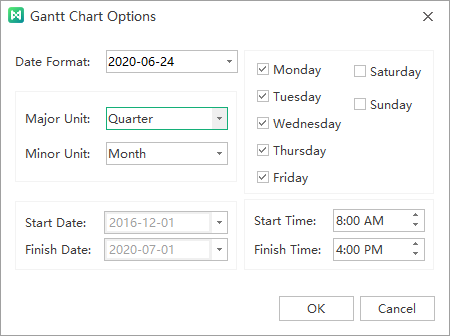
Set Gantt Chart Options
On Gantt Chart Option window, you can set date format, major and minor unit, select workdays, set the start and finish time of the whole project.
To open Gantt Chart Option window, you can
- Go to Advanced tab and click Gantt Chart Option button.
- Navigate to Task pane and click Set Gantt Chart Option button.
Add or Remove Tasks
You can add task information to a topic and the information will be shown at the bottom of the topic.
Select a topic you intend to assign tasks. Open Task pane.
- Click Add task info button
 to add a new task to a topic or click the Add all task info button
  to add tasks for all topics.
 - Click Delete task info button
 to remove the task from a topic or click the Delete all task info button
  to delete tasks from all topics.
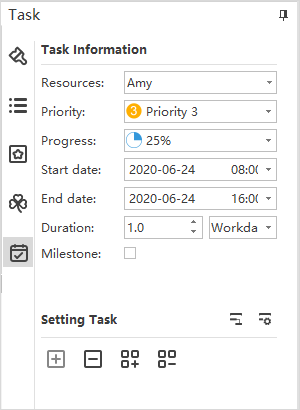
On Task pane, you can edit task information with the provided task info options.
- Click the drop-down Resource list and select resources.
- Select task priority level in the drop-down Priority list.
- Select a progress icon in the drop-down Progress list.
- Set project start and end date by selecting dates in the drop-down calendar.
- Duration will be generated automatically, and the unit of duration can be adjusted in the drop-down Duration list.
- Tick Milestone to denote a milestone task.
Note: You can create and manage resources by adding and managing tags.
Modify Task Info in Gantt Chart Pane
Each task is presented as a taskbar in a Gantt chart. You can move or drag the taskbar to change its start and end date. You can also build task dependency on Gantt Chart pane.
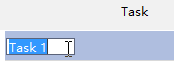
1. Rename Task
Double-click the cell in Task Name column to rename the task.
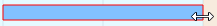
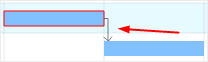
2. Change Task Start and End Date
Drag the right border of the bar to change the bar length. Select and move the bar to change its position on the calendar.
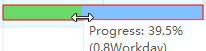
3. Change Task Complete Percentage
Put the cursor on the left border of the task bar, hold the mouse and drag to the right direction, and a green area will show up. This green bar means how much the task has been completed.
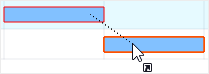
4. Build Task Dependency
Click on a taskbar, hold the mouse and drag it to another taskbar, then a relationship will be created.
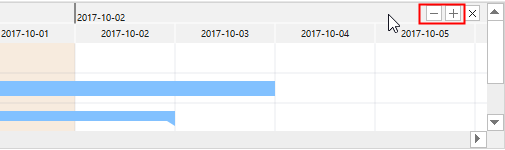
5. Change Date Unit
Click + and - button on the top right corner of Gantt Chart pane to change date unit.
Export Gantt Chart
The export function will help you save Gantt charts as PDF files, which is convenient for you to print or share Gantt charts with others.
- Go to Advanced tab and click Export Gant Chart button.
- Type a name for the Gantt chart in the saving window.
- Click Save.