How to Design Architecture Infographics
Great architecture infographics should be clear, easy to digest, and eye-catching. As far as Edraw Infographic Software is concerned, this refers to the content layout in your infographics. A well designed Information Architecture can make all the difference between a broadly used portal and a normal one. The development of the Infographic is very fast, but Edraw can help you cope all the challenges with its newly released version.
Here is one great example created by Edraw.

Download this Newly Released Infographic Software for Free and Get Started Now
How to Create Architecture Infographics
The 5 Steps below are general guidelines to point you in the right direction of Infographic creation. This brand new infographic software can help you create beautiful and easy-to-follow architecture infographics with various of built-in elements and examples that are availabel for free download and customizing.
-
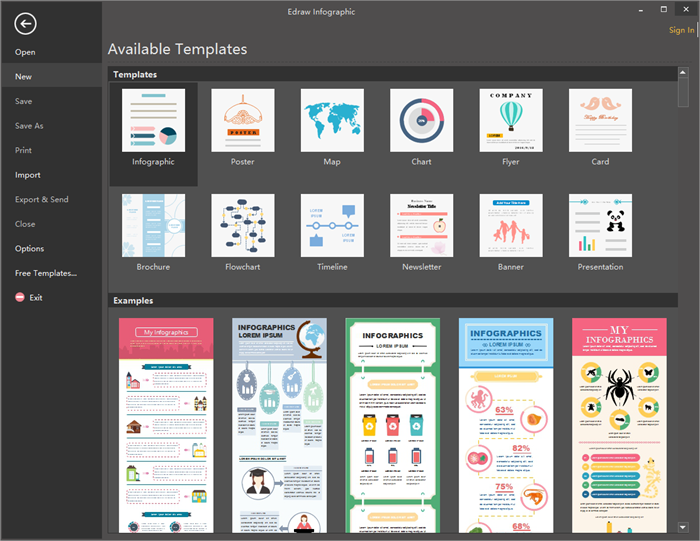
Step 1: Open a new infographic drawing page.
Run Edraw Infographic Software and go to File menu, click New - Infographics to start a new infographic drawing page for the design of your architecture infographic. If this is your time of trying to design an infographic and have no idea where to start, simply choose one of the examples prepared by our professional designers and then customize your own. All examples on Edraw are available for free download and can be customized.
-
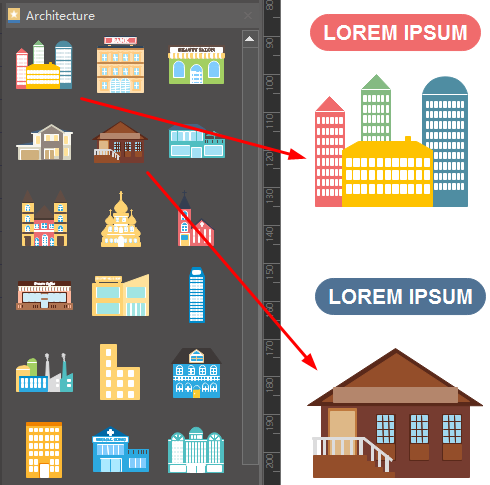
Step 2 - Add objects to the drawing page by dragging them from the library on the left
Elements for architecture infographics lays under "Libraries - Symbol - Architecture". Drag and drop them on the drawing page. Color, size and directions of all elements are editable, you can modify as you want for your design. More types of symbols can be found in the libraries.
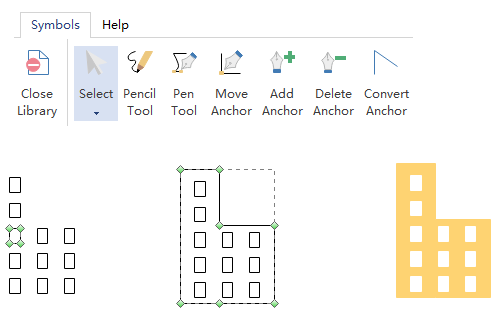
TIP: If you happen to fail to find the right element among the ready-made shapes in "Architecture" category or others, use the "Pen Tool" to draw elements yourself. "Add Anchor" and "Delect Anchor" buttons will help you will the curves of shapes. Hit "Convert Anchor" if you need to change a round angled curve into a rectangular angled curve. It is very convinient.
-
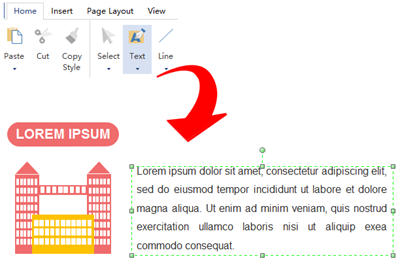
Step 3 - Type in text to complete the infographic
Go to "Home" - "Text", draw a text box then type in the contents.
-
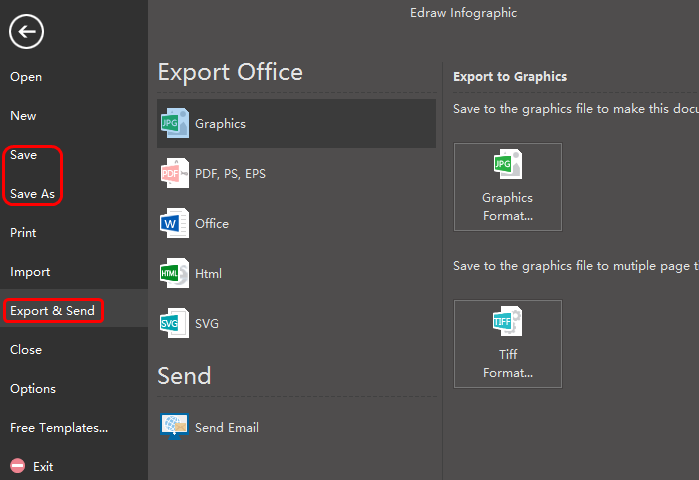
Step 4 - Save or export architecture infographics
Once finished deisgning your architecture infographic, click "Save" under "File tab" to save the infographic as the default .eddx format. Or, users can also choose to "Export & Send" under File to export the infographics to any formats that's convenient to share, such as Word, PPT, PDF, images or even Visio.
Related Articles

