Influence Diagram
A summarized form of a decision tree can be considered an Influence Diagram. In simple words, an influence diagram is a visual representation to give the viewers a quick glimpse of a detailed and elaborated decision tree. Such charts are small in size and have fewer elements. Therefore, it is a bit easier to understand these drawings as compared to going through the lengthy decision trees.
With that being said, here you will learn all about the influence diagram, what is the purpose of drawing one, what do you need to draw such an illustration, how to draw it easily and quickly.
Part 1: What is an influence diagram?
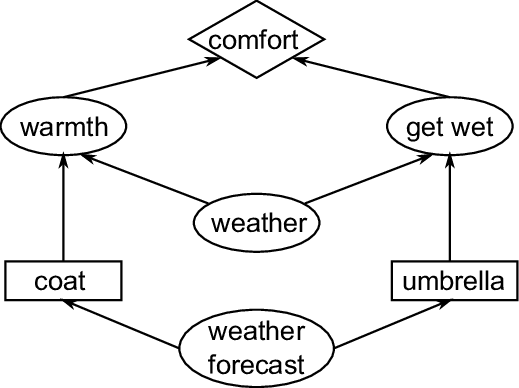
Source: https://www.researchgate.net/
An influence diagram is a graphical depiction of problems and uncertainties that you may face if you take a particular decision. A typical influence diagram consists of four types of nodes (shown with the help of different shapes), each of which reflects a particular element. These nodes are:
- Decision
- Chance Variable
- Ultimate Evaluation
- General Variable
A decision is an action that you take after thorough brainstorming. Depending on your experience and the type of situation you are facing, your decision may vary.
Any outcome that you may or may not get after you have taken a decision and have acted upon it is a chance variable. Where making a decision is in your hands, the chance variable is something that cannot be controlled, and it solely depends on how efficiently and timely your action was executed.
This node tells whether the outcome that you received after executing your decision was beneficial for you and the organization or the plan backfired. This evaluation helps you decide your next move for the betterment of the company.
This node tells whether the outcome that you received after executing your decision was beneficial for you and the organization or the plan backfired. This evaluation helps you decide your next move for the betterment of the company.
The nodes discussed above are arranged in a particular way to show the summarization of the decision tree and what did you achieve after your plan was executed. Generally, an influence diagram is used in conjunction with the decision tree.
Part 2: Purpose and Benefit of Influence Diagrams
The purpose of an influence diagram is to determine the type of situation, whether taking a particular approach to execute a plan would be fruitful in the long run, what uncertainties does it come with, and what you could achieve if the plan is executed.
The advantage of an influence diagram is that it helps you analyze the outcome. With that kind of assessment, you can choose whether or not it is a good time and/or situation to make the decision you are about to make.
Learn more about how to perform situation analysis.
Part 3: Symbols Used in an Influence Diagram
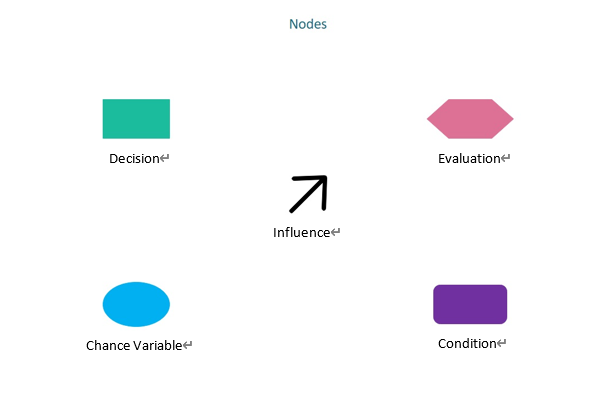
An influence diagram doesn’t consist of many symbols, and merely adding the key nodes, arranging them correctly, and connecting them properly with the help of the arrows (influences) is all that you need. The symbols of nodes and arrows used in an influence diagram are listed below:
EdrawMax
All-in-One Diagram Software
- Superior file compatibility: Import and export drawings to various file formats, such as Visio
- Cross-platform supported (Windows, Mac, Linux, Web)
Part 4: What to Do before Creating an Influence Diagram?
Even though an influence diagram doesn’t have many symbols and icons, there are still a few points that you must consider and a couple of ingredients that you must keep in handy before starting with the drawing process. These key points and elements include:
- Understanding of the Situation
- Understanding of Symbols
- Decision Tree
- An Efficient PC Program
Before diving into the drawing process, make sure that you have a thorough understanding of the situation you are planning to make the decision for. Incomplete information may result in wrong outputs, and your organization may suffer from economic loss.
It is imperative to have a good understanding of all the symbols that are used in an influence diagram. Using the wrong icons or placing them incorrectly may confuse the other people involved in the process and/or project.
As mentioned earlier, an influence diagram is a visual summarization of a decision tree, and in most cases, the two charts are used in conjunction with each other. Therefore, make sure to keep a copy of the related decision tree for reference while preparing an influence diagram.
Even though you can draw an influence diagram manually, the process may take a significant amount of time and effort. Therefore, it would be wise if you use an efficient computer application like Wondershare EdrawMax not only expedites the drawing process but also enables you to use the correct symbols from its built-in library.
Part 5: How to Create an Influence Diagram?
EdrawMax is a dedicated diagramming tool that has several integrated categories representing different industry types. Each of the categories has a built-in library that is populated with relevant symbols and icons to make your illustration creation task easier.
You can learn how to make an influence diagram in Wondershare EdrawMax by following the instructions given below:
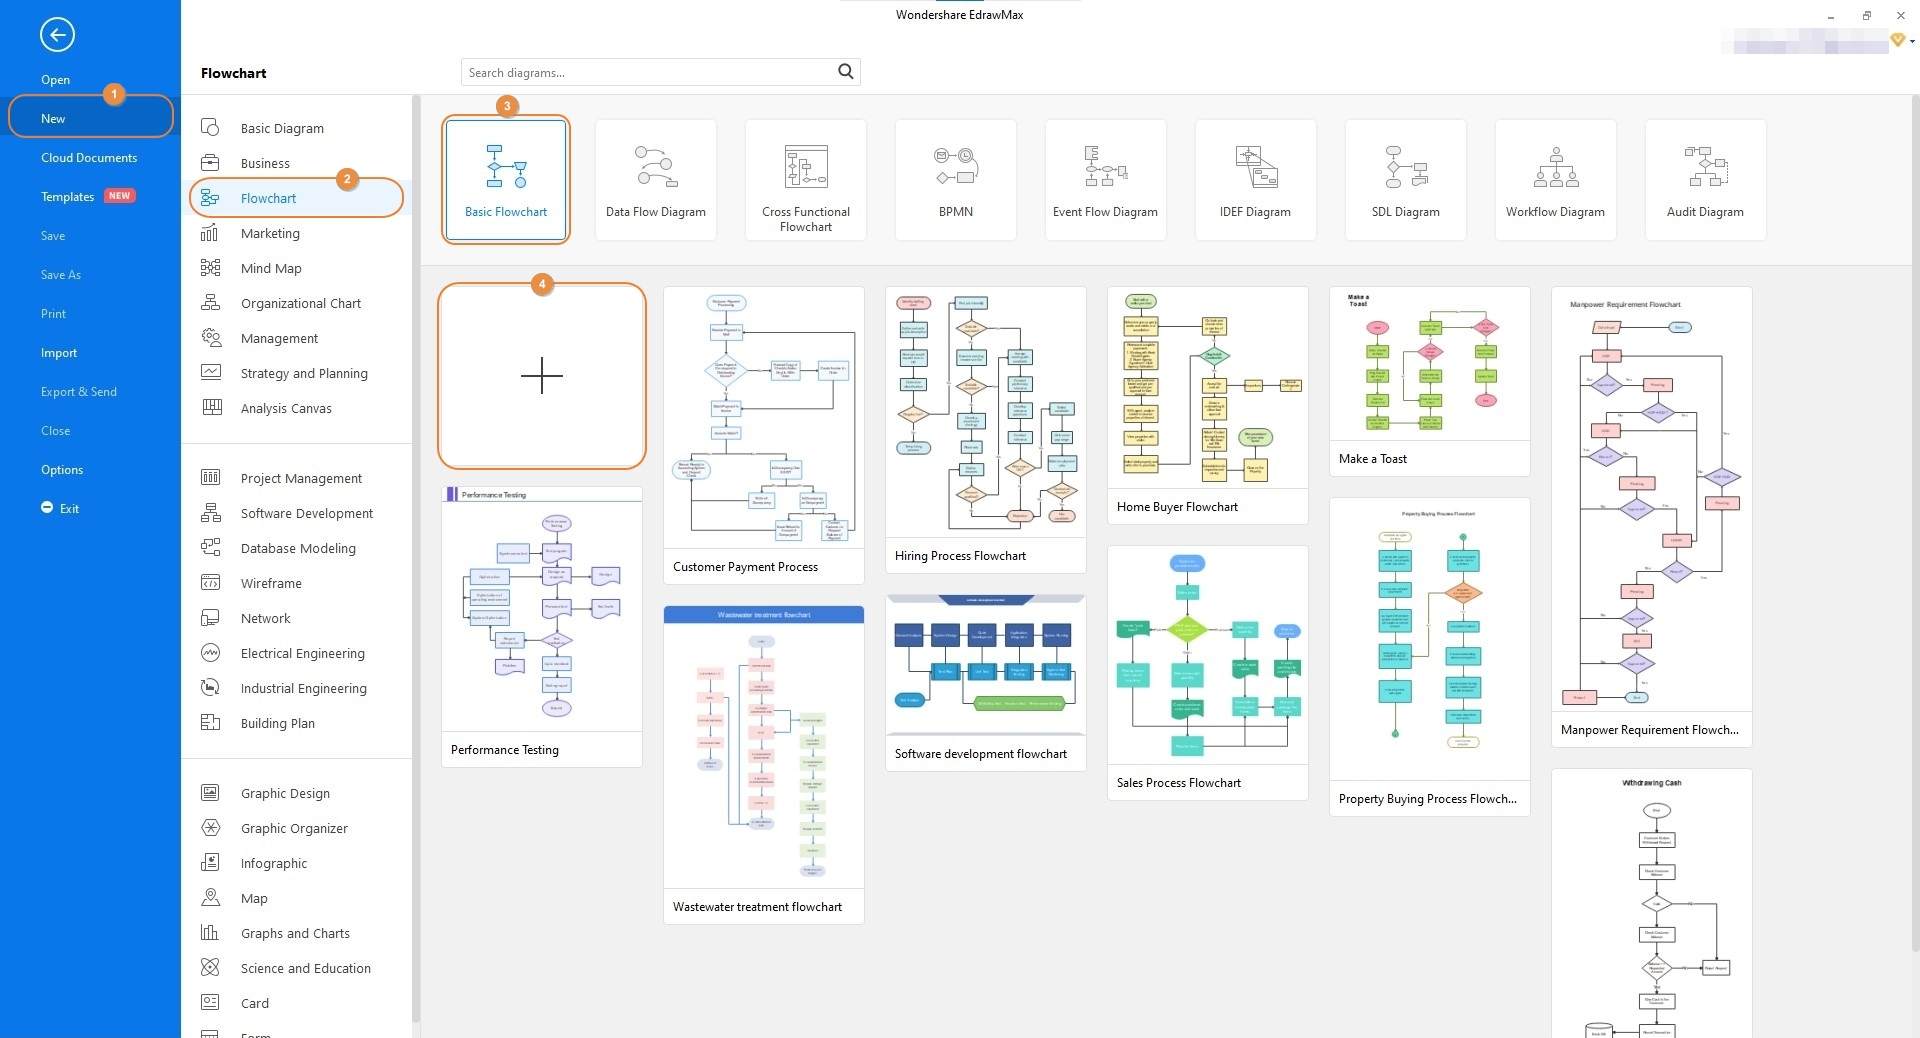
Step 1: Start with a Blank Document
Launch Wondershare EdrawMax on your computer, make sure that New is selected in the navigation bar on the left, click to select Flowchart from the center pane, and click Basic Flowchart from the top row of the right window. Next, click the tile with the + icon to start a new blank project.
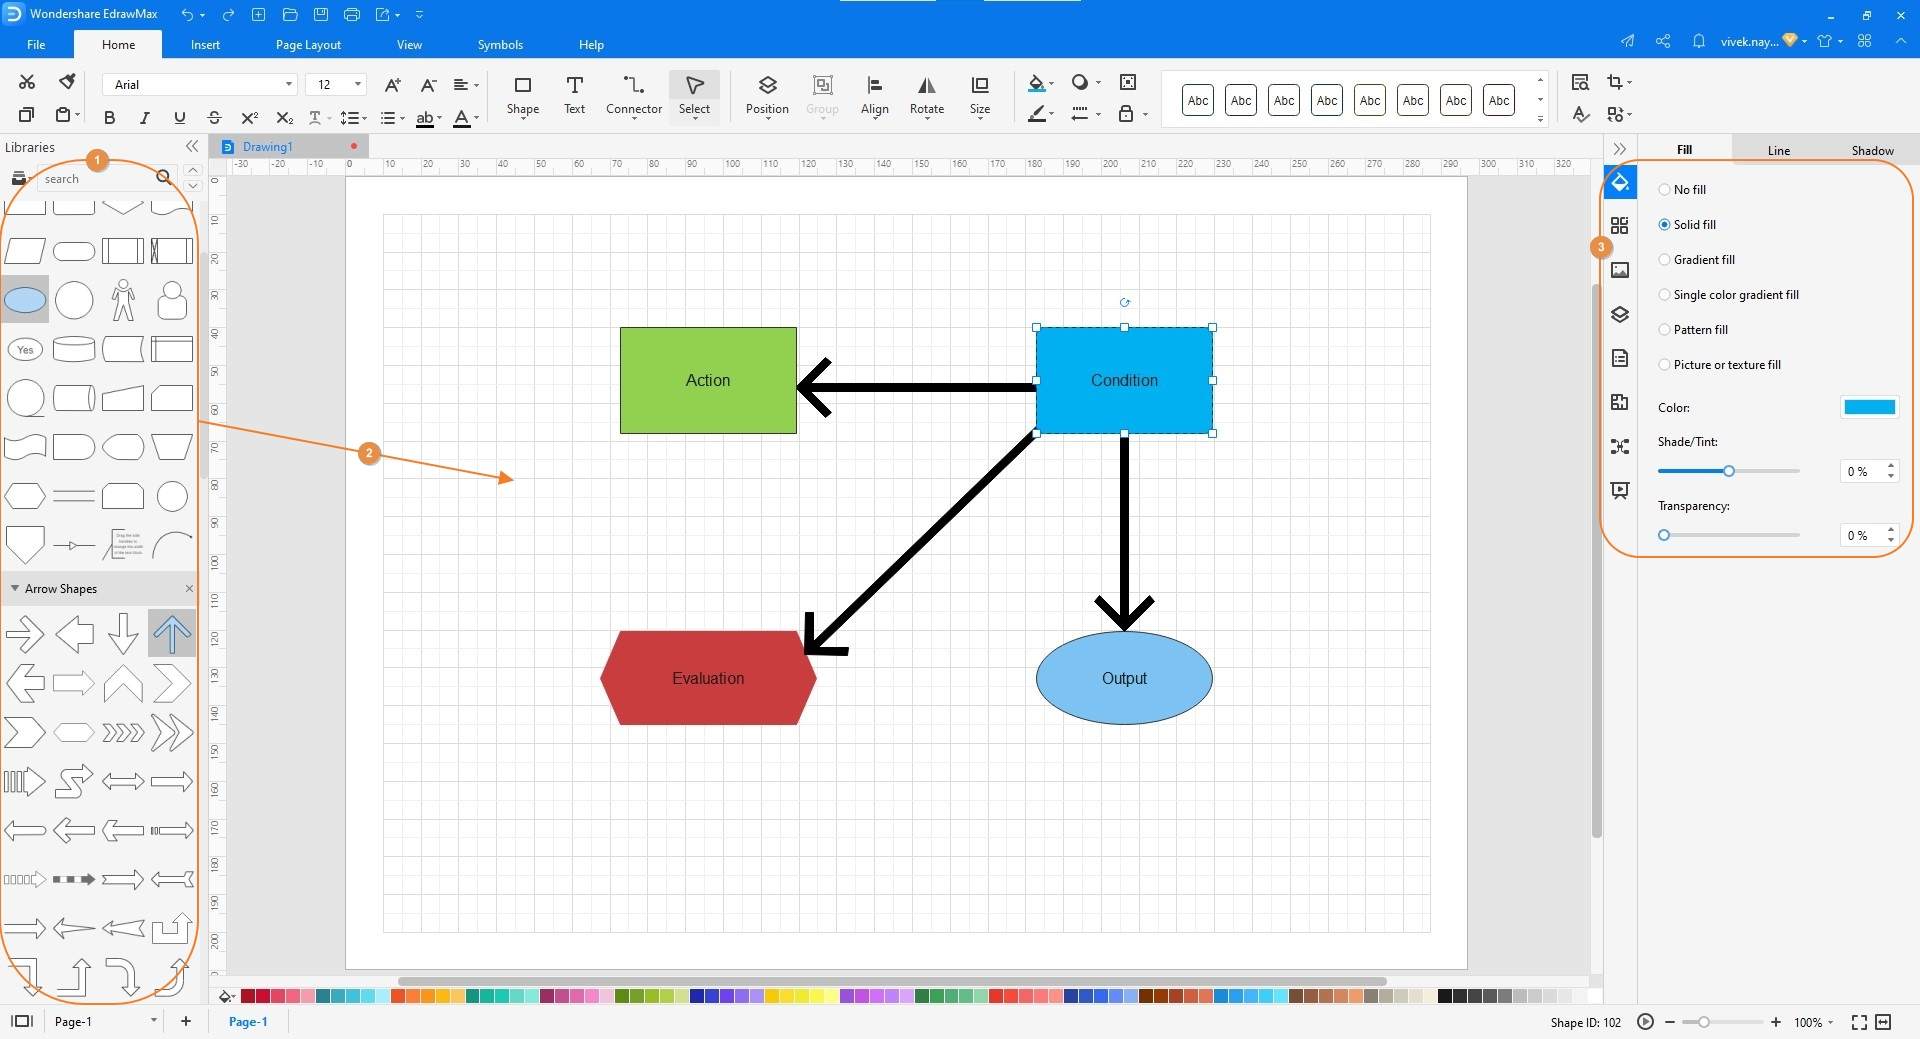
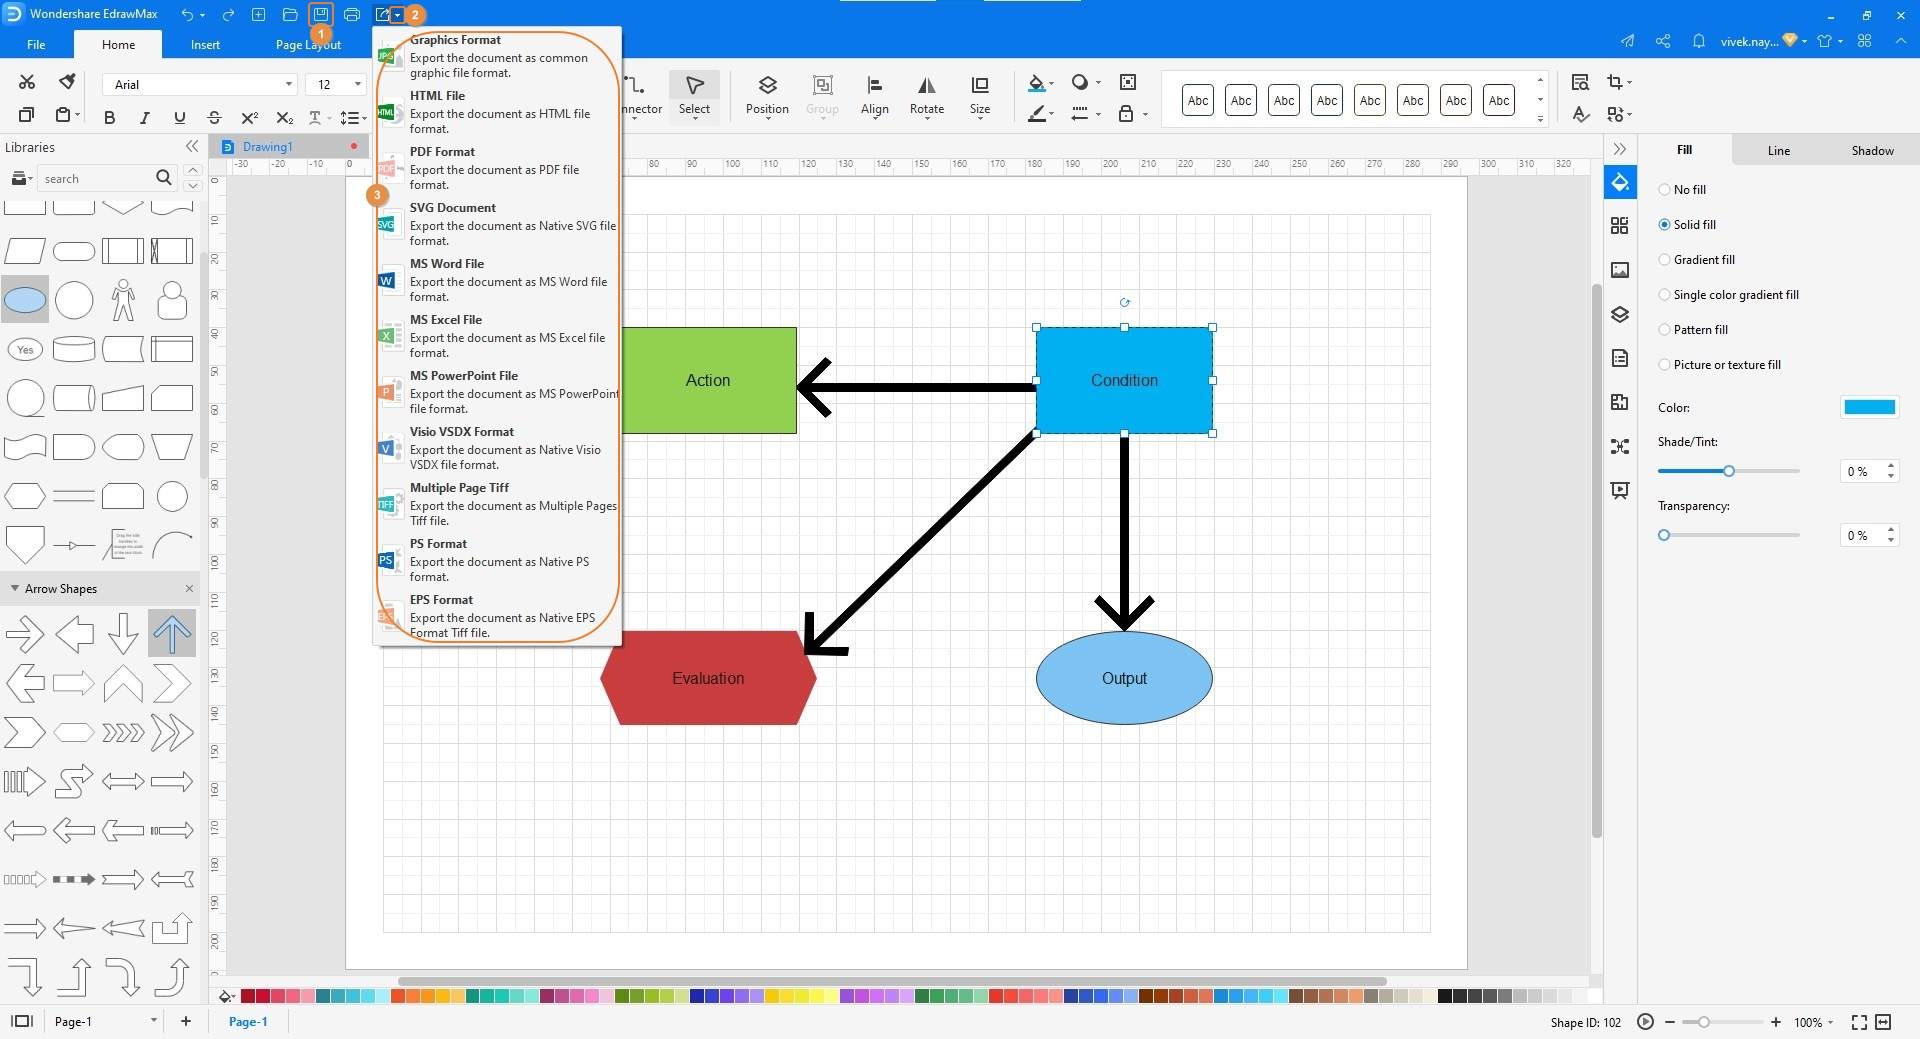
Step 2: Add Symbols and Make an Influence Diagram
Drag the symbols representing the nodes from the library on the left to the Canvas. Draw the arrows to show the influences. Use the tools present in the right pane to color the shapes as needed. Double-click a shape and add a caption to it. Repeat this process to label all the symbols in the chart to complete the influence diagram.
Step 3: Save and export the influence diagram
Click the [Save] icon from the Quick Access toolbar at the top-left corner, and save the influence diagram. Next, click the More button on the Export icon, and from the available list of options, choose your preferred format to export the illustration.
Part 6: Tips for Making Influence Diagrams
Given below are a few tips from the professionals to help you prepare an intuitive and easily readable influence diagram:
- Use the industry-standard colors for different types of nodes. For instance, use green color for the Action node and blue for the situation. Likewise, use purple and light blue for Evaluation and Chance Variable (Outcome), respectively.
- Leave sufficient gaps between the nodes so you can add the descriptions if need be.
- Do NOT forget to label the nodes for better understanding.
- Use an efficient PC program wherever possible to draw an efficient and intuitive influence diagram.
Part 7: Influence Diagram Examples
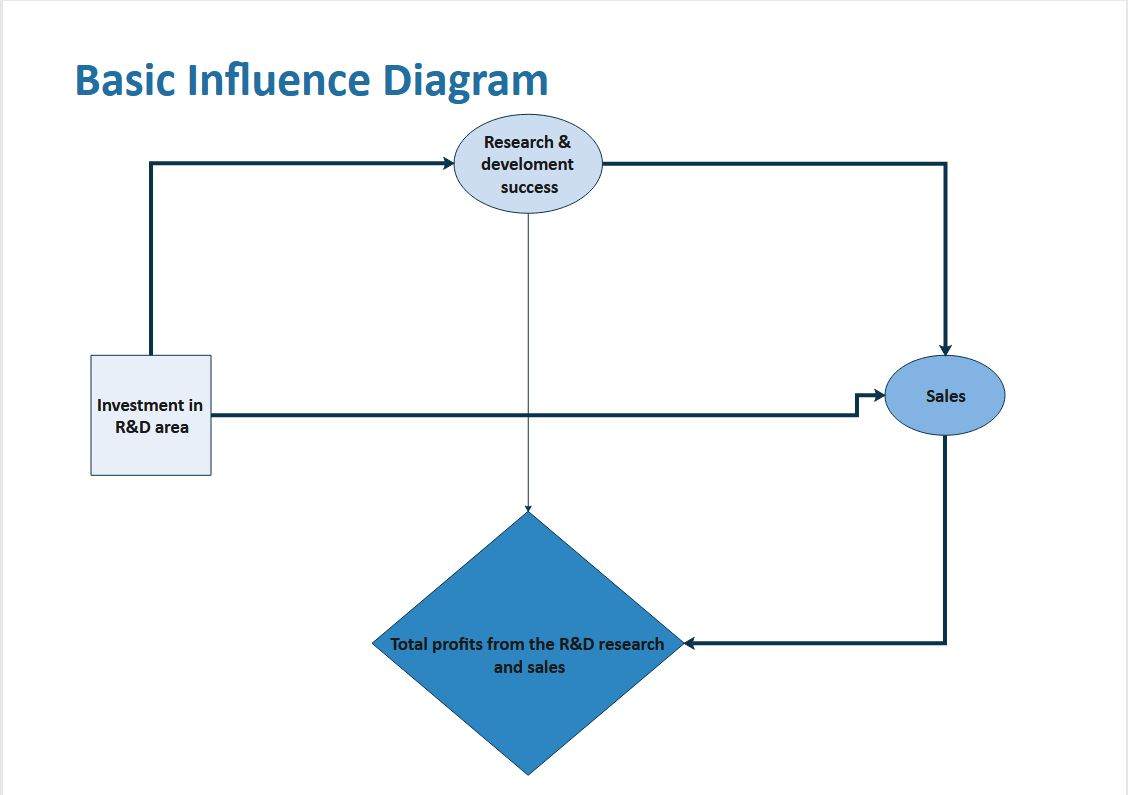
In the above image, the Research and Development department of an organization plans to research something. The team understands that there are high chances of getting the success that would directly affect the sales of the product. With that kind of selling, the organization would be in profit, and the credit will go to the R & D department.
Conclusion
An influence diagram is a brief and summarized representation of what a decision tree illustrates. This is why in most scenarios, the two charts are used in conjunction with each other. While you can draw an influence diagram manually, using an efficient diagramming tool such as EdrawMax would be a wise approach in order to expedite the creation process and also to come up with a clear and correct illustration.
More Related

