
範本社群 /
Project Relationship Matrix Status Tracking Template
Project Relationship Matrix Status Tracking Template
PlotWizard
發佈於 2026-05-19

 桌面
桌面

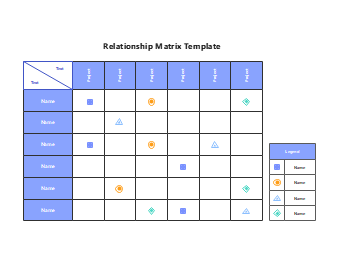
This image is a professional project management and data analysis relationship matrix template tailored for tracking cross-project associations and task statuses. It visualizes the complete cross-project relationship workflow in a matrix layout: rows represent individual entities/stakeholders (labeled "Name"), columns represent different projects, and custom icons (square, circle, triangle, diamond) mark the type or status of each entity-project relationship, with a clear legend for interpretation. It clearly illustrates the integration of entity-project mapping, relationship type classification, and status tracking stages, making it an essential visual tool for project management, cross-team collaboration, and data analysis industries.
This template is designed for project managers, data analysts, team leaders, and cross-functional stakeholders. It is widely used in multi-project management, stakeholder mapping, task dependency analysis, and resource allocation scenarios, including project relationship reports, stakeholder engagement tracking documents, cross-project dependency analysis materials, and resource planning summaries.
The matrix breaks down the complex cross-project relationship system into clear, modular relationship nodes, helping stakeholders quickly understand entity-project associations, relationship type distribution, and status visibility. It supports the visualization of cross-project dependencies and stakeholder engagement levels, ensuring consistent communication between project, analysis, and execution teams. This template is highly adaptable to various multi-project management and data analysis scenarios, enabling efficient creation of standardized relationship matrix charts that align with industry best practices for clear relationship mapping, status transparency, and collaborative efficiency.
Tag
Cross Project Entity Relationship Visualization
Multi Project Stakeholder and Task Mapping Infographic
Project Relationship Matrix Template
分享

張貼
推薦 範本
正在載入
