テンプレートコミュニティ /
Gauge Charts of Speedometer
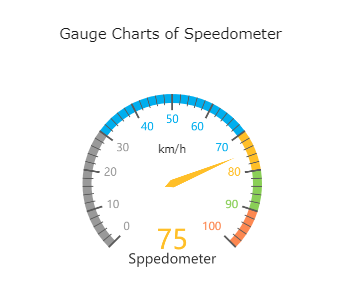
Gauge Charts of Speedometer
Joy
に公開されました 2021-09-22
AIでダイアグラムを生成
テンプレート
デスクトップ版
A Gauge Chart can use colored bands, hands, and combinations to display multiple values and their relation to a numeric range. They are found in vehicles or heavy machinery.
Tag
Gauges
graph and chart
Graph Chart Collection
シェア
コメントを追加
投稿
おすすめ
テンプレート
読み込み中
Close
Close


 デスクトップ版